
It remains all about the coming Fed tightening cycle, not only in terms of rate hikes but also Fed balance sheet contraction.
And, unfortunately for stock markets, the Federal Reserve provided little relief on that score at the last FOMC meeting on 25-26 January.
Indeed markets are still faced with uncertainty in terms of both the timing and the scale of any potential quantitative tightening, though Jerome Powell did allow himself a slight dovish tilt by saying the Fed would rely “primarily” on not reinvesting maturing bonds rather than outright asset sales as the main driver of balance sheet reduction.
Still, the continuing uncertainty on quanto tightening is somewhat ironic given the lengths the Fed and other G7 central banks have gone to in recent years not to surprise markets.
Recall the rather ridiculous notion of “forward guidance” and Ben Bernanke’s incredibly irresponsible pledge not to raise rates for two years back in 2011 which set off the mother of all carry trades.
But that was then and this is now. Investors are not just having to contest with a perceived behind-the-curve Fed which is not just perceived as needing to tighten to restore its own credibility, but one which is under political pressure to tighten as discussed here previously (see The Taper Tantrum Ain’t Over Yet, 17 January 2022).
This has literally not been the case in America for decades, probably not since Paul Volcker succeeded William Miller back in 1979.
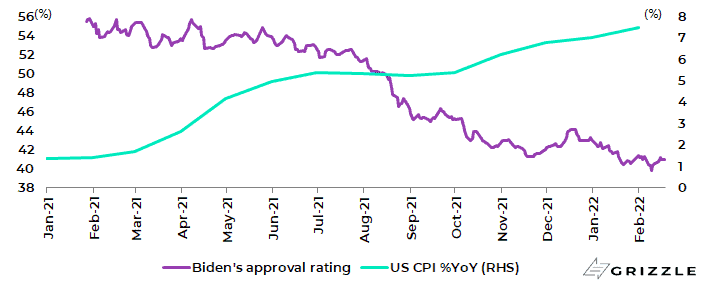
The reason for that political pressure is evident from the collapse in Joe Biden’s polling data along with the rise in inflation.
Biden’s approval rating has declined from 55.8% in late January 2021 to 41%, while US CPI inflation has risen from 1.4% YoY in January 2021 to 7.5% YoY in January 2022.
President Joe Biden’s approval rating and US CPI inflation
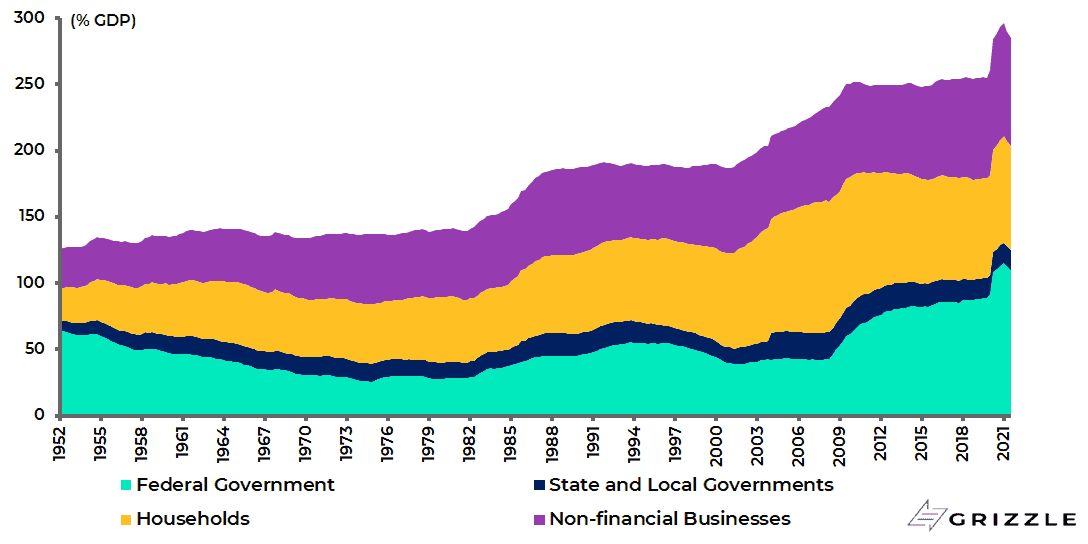
The difference, of course, is that when Volcker embarked on his monetary tightening cycle back in 1979, raising the federal funds rate from 10% in early 1979 to 20% in March 1980 (the effective fed funds rate eventually peaked at 22.4% in July 1981), debt levels in America were dramatically lower than is the case today, be it in terms of government debt to GDP or non-financial sector debt as a percentage of GDP.
Thus, US non-financial sector debt and government debt were 285% and 125% of annualised GDP respectively at the end of 3Q21, compared with 140% and 40% at the end of 1979.
US non-financial sector debt as % of annualised GDP
Monetary Tightening Becomes More Deflationary the More Debt We Owe
The above is relevant because the much higher debt levels mean the deflationary impact of monetary tightening impacts much more quickly, most particularly if that form of tightening involves the much blunter mechanism of central bank balance sheet contraction.
The above dynamic is because the marginal utility of debt has been declining for years in the Western world as higher debt levels have led to slowing economic growth.
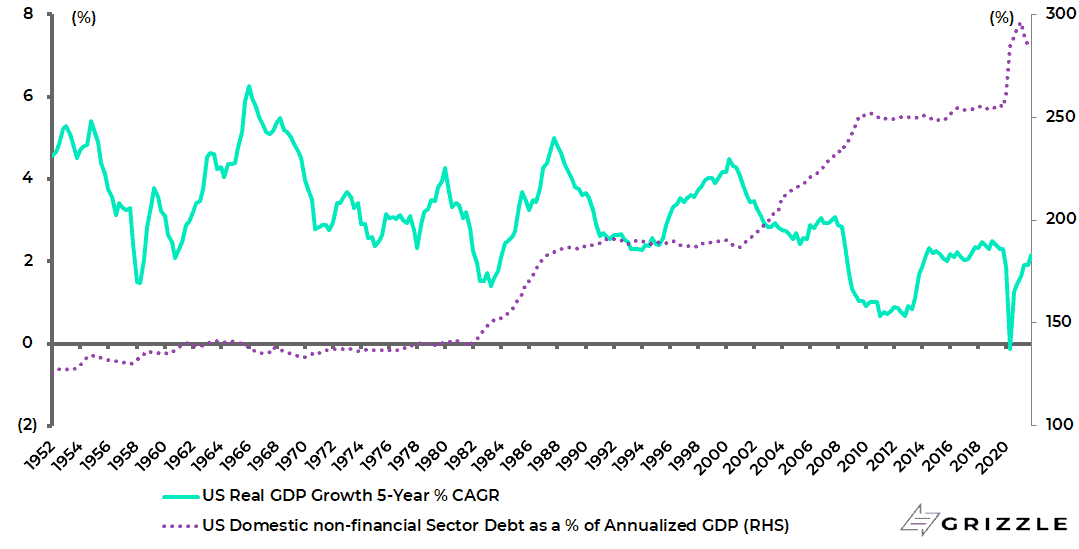
Thus, US five-year annualised real GDP growth declined from 6.3% in 1Q66 to 2.1% in 4Q21, while US non-financial sector debt to annualised GDP increased from 138% 1Q66 to 285% in 3Q21.
US real GDP 5-year annualised growth and non-financial sector debt to GDP
The downside of debt-driven growth is a charge which has usually been leveled against China in recent years, if not recent decades, with China bears long predicting the collapse of the command economy model.
Still, the reality is that a lot of the build-up in debt in China in the past two decades has gone into productive infrastructure which has added economic value.
That is much less the case in the G7 world.
But this is to digress.
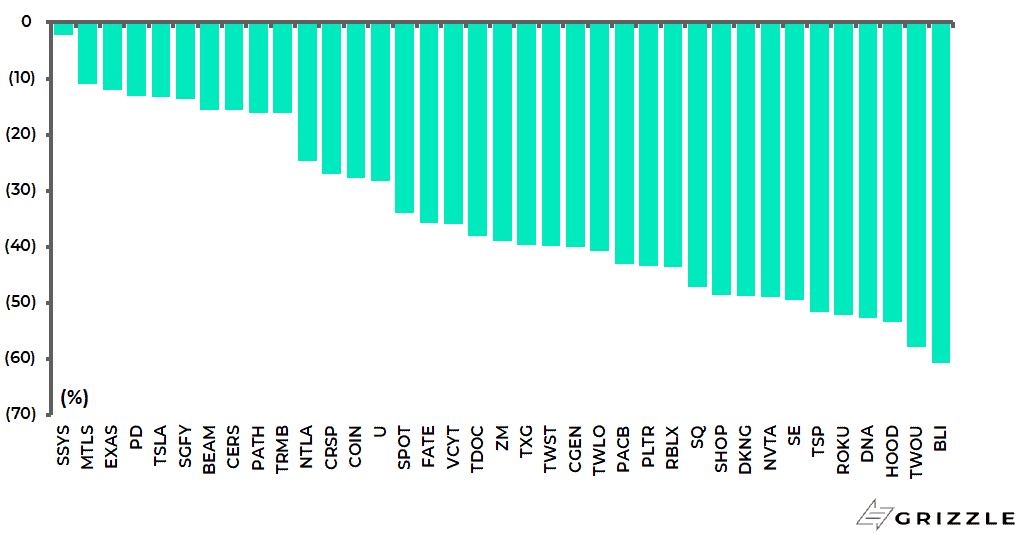
If the Fed is really intent, for now at least, on implementing meaningful monetary tightening, the only sensible course for equity investors is to continue to look to sell rallies in growth stocks.
In this respect, all the 37 stocks in the ARK Innovation ETF are now trading below their 100-day moving average while, unsurprisingly, the crypto asset class has also succumbed to the tightening scare.
It will, in this writer’s view, remain under pressure so long as quantitative tightening is on the Fed’s agenda.
Stocks in the ARK Innovation ETF (ARKK) basket: % down from their 100DMA
ETF Investors Are Still Buying the Dip
Meanwhile, it is interesting that outflows out of US equity ETFs have barely commenced.
Domestic equity ETFs recorded an estimated outflow of only US$5.2bn in the week ended 19 January but an estimated inflow of US$30bn in the subsequent three weeks to 9 February, according to the Investment Company Institute.
This compares with US$30bn of inflow in the first two weeks of January and US$503bn in 2021.
US domestic equity ETFs’ net inflows
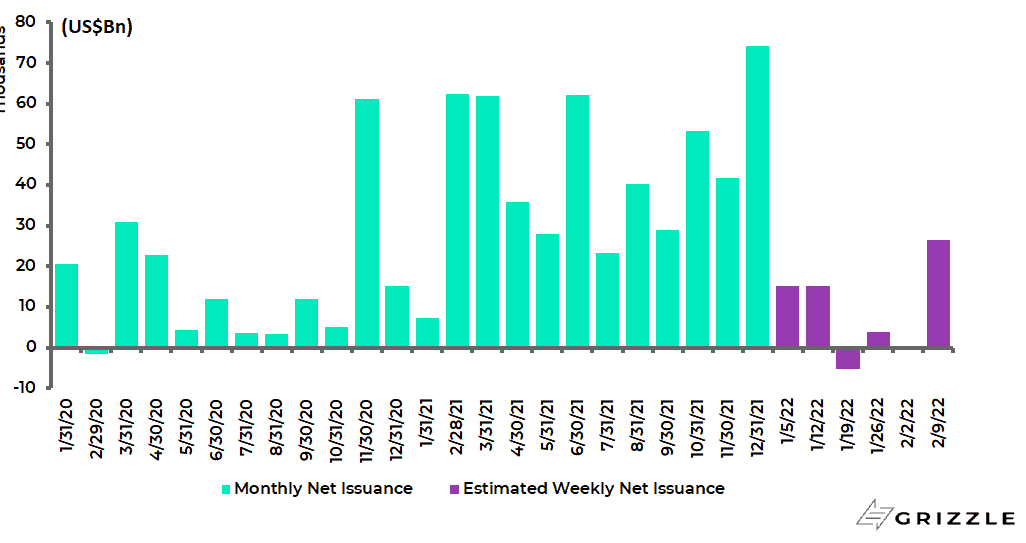
The last time there was a monthly outflow in this category was in February 2020. This reflects the strength of the belief in “buy the dip”.
Yet as Fed tightening proceeds, and for now this writer will have to take the Fed at its word, it should be expected that the damage will move from the high beta area of equities, such as ARK and its equivalents, to the more mainstream parts of the market such as FAANGs.
For clearly the more the Fed tightens, the more it should be expected that cyclical optimism on the economy will be questioned, not to mention the wealth effect of all the money which will have been lost in the markets.
In this respect, the crypto asset class totalled US$3tn at its peak in November which begins to be a meaningful number in macroeconomic terms.
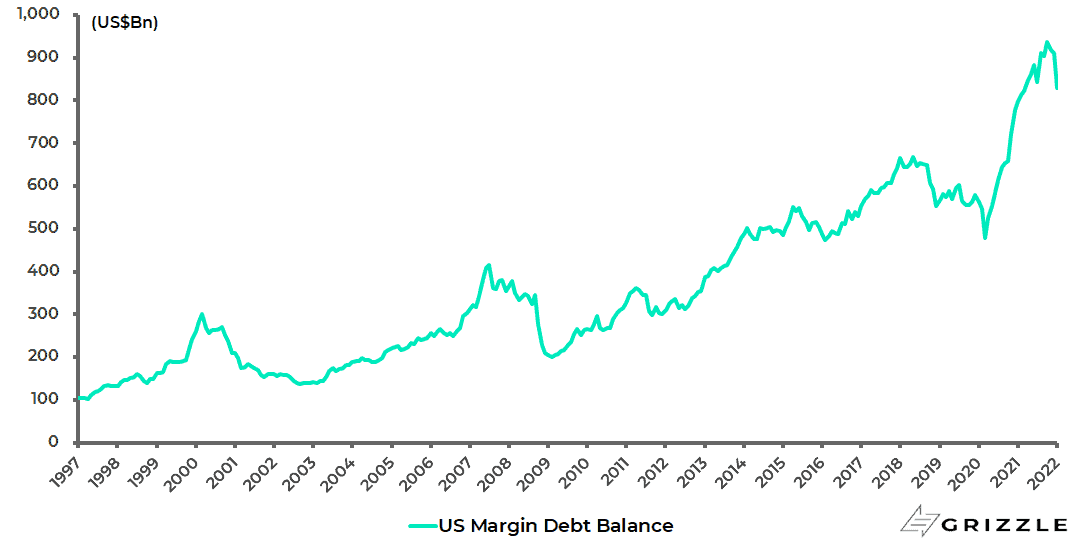
While there has been a meaningful retail component in the transfer payment-driven Covid bull market in America the past nearly two years, as reflected in the surge in margin debt which has just started to decline.
US margin debt balance
This wealth effect dynamic also increases the likelihood that Americans revert to deleveraging the longer Fed tightening proceeds, in terms of a personal savings rate which is now at 7.9% of disposable income, or at a similar level as prevailing prior to the pandemic.
US personal savings as % of disposable income

A Weaker Consumer Will Give Economic Cover to a Policy Pivot
Still, the silver lining of such an outcome is that it will give an excuse for the Jekyll and Hyde Fed to execute yet another U-turn, just as it has done such a complete U-turn in the past two months.
For if the money markets are now discounting six rate hikes this year that does not necessarily mean all these rate hikes will happen.
There may also by then be political pressure for such a change.
But at present any such U-turn looks premature.
It is also the case that the political advocates of equity market friendly Modern Monetary Theory (MMT) are, at least for now, seemingly on the back foot since the policies of MMT-lite implemented by the Fed in response to the pandemic have had just the inflationary consequences that monetarist critics would have predicted.
In that respect, the pressure on the Fed to be seen to be doing something on inflation is now coming from the moderate side of the Democratic Party which fears a Republican landslide in November while the so-called progressives are on the defensive, having overplayed their hand in terms of what they tried to implement in the now lapsed “Build Back Better”.
In this respect, it is interesting that a Gallup Poll released on 26 January showed that 79% of Americans expect inflation to be higher in the next six months, the highest percentage since Gallup first asked such a question in 2001.
The views expressed in Chris Wood’s column on Grizzle reflect Chris Wood’s personal opinion only, and they have not been reviewed or endorsed by Jefferies. The information in the column has not been reviewed or verified by Jefferies. None of Jefferies, its affiliates or employees, directors or officers shall have any liability whatsoever in connection with the content published on this website.
The opinions provided in this article are those of the author and do not constitute investment advice. Readers should assume that the author and/or employees of Grizzle hold positions in the company or companies mentioned in the article. For more information, please see our Content Disclaimer.