

The Macro Battleship columns have dealt up till now with more ‘Big Picture’ matters. Following the machine-driven stock market correction discussed here last week, it is worth outlining the recommended asset allocation in terms of which stock markets investors should favour.
The main recommendation here is to invest in Asia and emerging markets. In the developed world Japan is favoured over Europe and America, in that order. But Asia and emerging markets are favoured above all.

The obvious risk in the above recommended strategy is that what worked in 2017 may not work again this year since Asia and emerging markets did better than the American market last year in US dollar terms. The MSCI AC Asia ex-Japan and Emerging Markets indices rose by 38.7% and 34.3% respectively in US dollar terms in 2017, compared with a 19.5% gain in the MSCI USA Index.
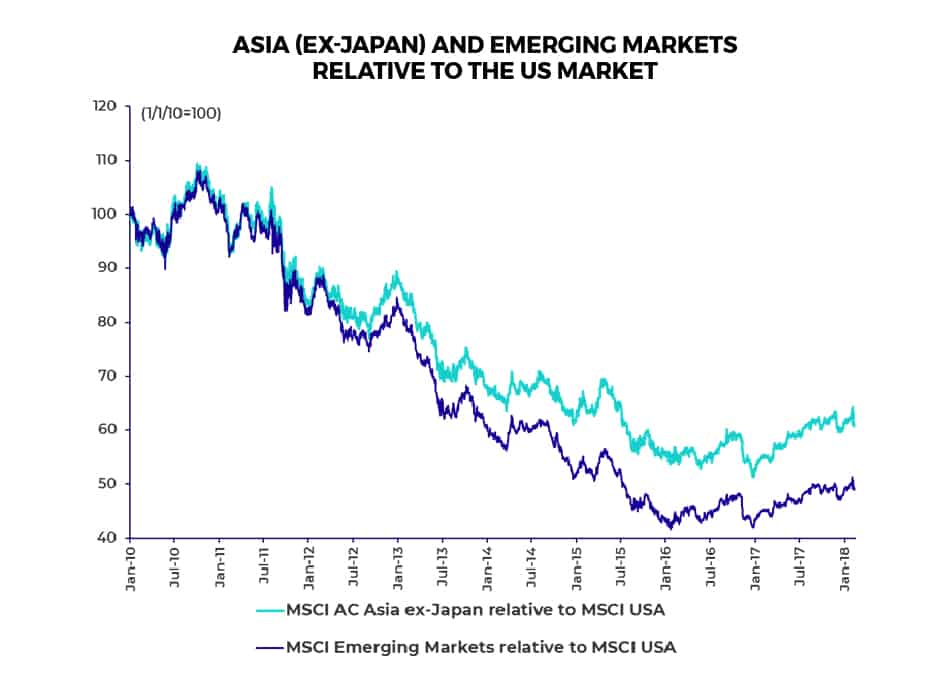
Asia & Emerging Markets – Plenty of Room for Catch-up vs. US Market
In the longer term time frame there is still plenty of room for catch-up. The US stock market outperformed Asia and emerging markets for more than five years since late 2010. The MSCI AC Asia ex-Japan and Emerging Markets indices underperformed the MSCI USA Index by 51% and 62% respectively in US dollar terms between October 2010 and January 2016 (see following chart).
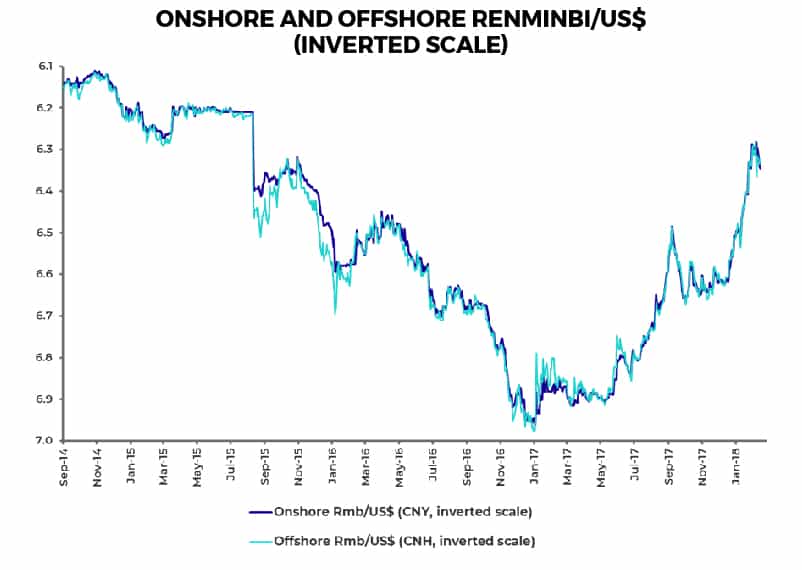
Forecasts of China’s Demise have been Greatly Miscalculated
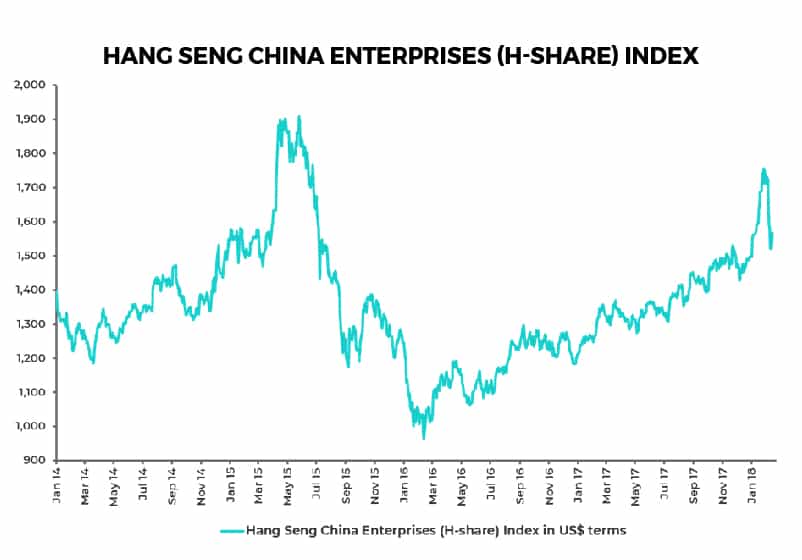
Asia’s relative underperformance bottomed at the start of 2016 when the consensus of investors, wrongly, forecast that China’s currency was about to collapse and its economy with it. Since then the Chinese currency has appreciated by 4% against the U.S. dollar (see following chart) while Chinese stocks quoted in Hong Kong, known as H shares, have rallied by 63% in US dollar terms (see following chart). Yet Chinese shares remain comparatively cheap. The Hang Seng H-share Index now trades at 9.6x trailing earnings and only 7.8x 2018 consensus forecast earnings, according to Bloomberg.
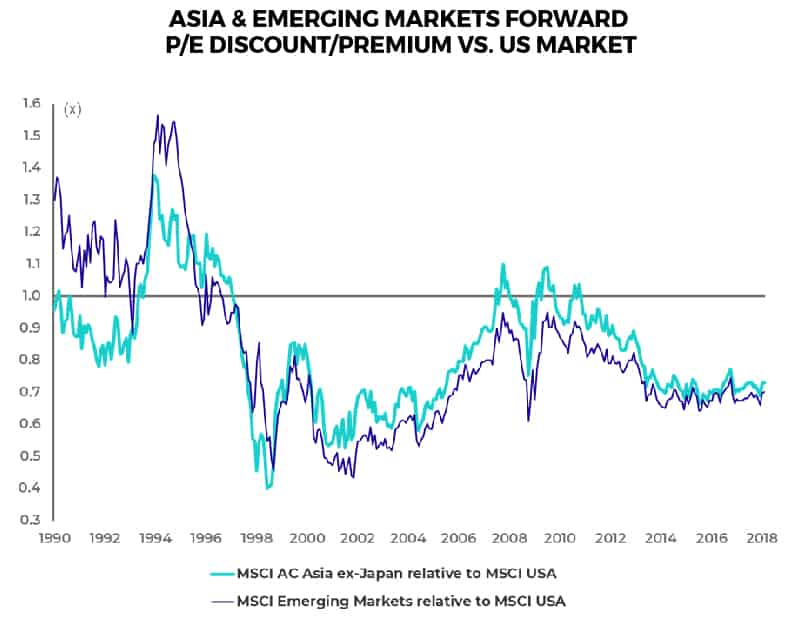
Asia & Emerging Markets Trade at a Sizable Discount to the US
There is now huge scope for Asia and emerging markets to enjoy their own extended period of outperformance. It’s clear from relative valuation charts that US valuations remain well above comparative markets. The MSCI AC Asia ex-Japan, Emerging Markets indices trade on a 27% and 30% discount to American valuations (see following chart).
Emerging Markets are Where Investors can Find Genuine Structural Growth
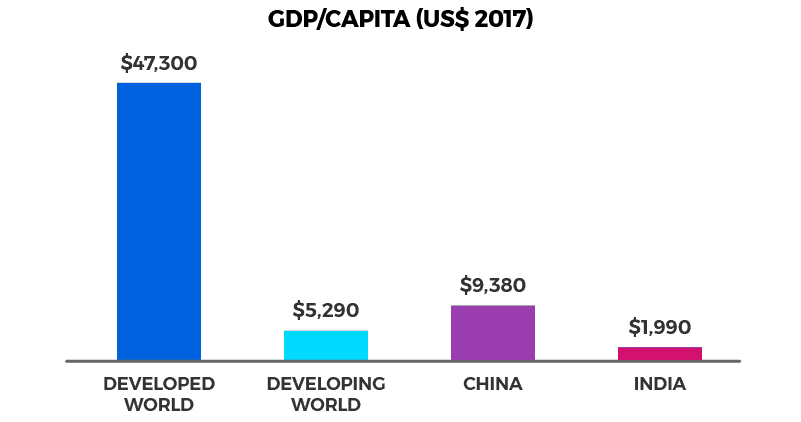
The other point about Asia and emerging markets is that this is where the growth is. While it is true that China’s demographics are no longer so positive, courtesy of the one child policy, which was implemented over a 30-year period, a trend growth rate in real GDP of about 6% still looks achievable in the years ahead.
Killing Polluting and Inefficient Industries has Made China’s Growth More Sustainable
But perhaps more importantly for stock market investors, the growth has become more disciplined as a result of the current Chinese leadership’s policy of supply-side reform, which has reduced excess capacity in areas like coal and steel in the past two years.
This policy is primarily driven by economic rationalization and the need to remove surplus workers from excess capacity industries to the new thriving service sectors. But supply side reform also had an anti-pollution environmental angle. Beijing in typically pragmatic fashion decided a few years ago to turn a negative (grim levels of industrial pollution) into a positive by targeting alternative energy as a new growth industry.
Japan: the Favoured Developed Market
Outside the emerging world (and China for all its spectacular growth over the past 20 years is still a developing country), the favoured stock market is Japan. The Nikkei 225 Index is still 46% below its high reached at the peak of the Japanese Bubble at the end of 1989, even after rising by 19% last year.
The fundamental picture in Japan reflects growing evidence of the easing of deflationary pressures — most importantly an ever tighter labour market, which is the result of Japan’s aging demographics.
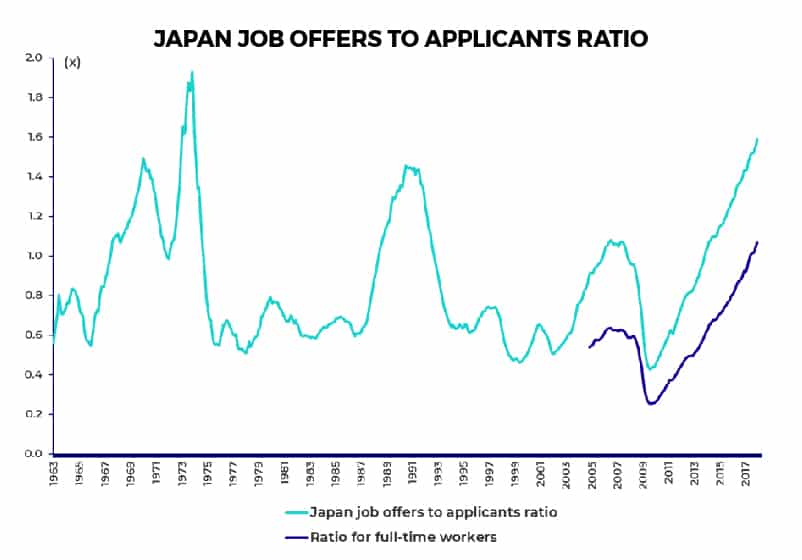
The job offers to applicants ratio rose to 1.59% in December, the highest level since January 1974 (see following chart). Similarly, the working-age female labour participation rate is now higher than the US. Japan’s working age (15-64) female labour force participation rate has risen from 63% in 2011 to 69.4% in 2017, compared with 67.9% in America.
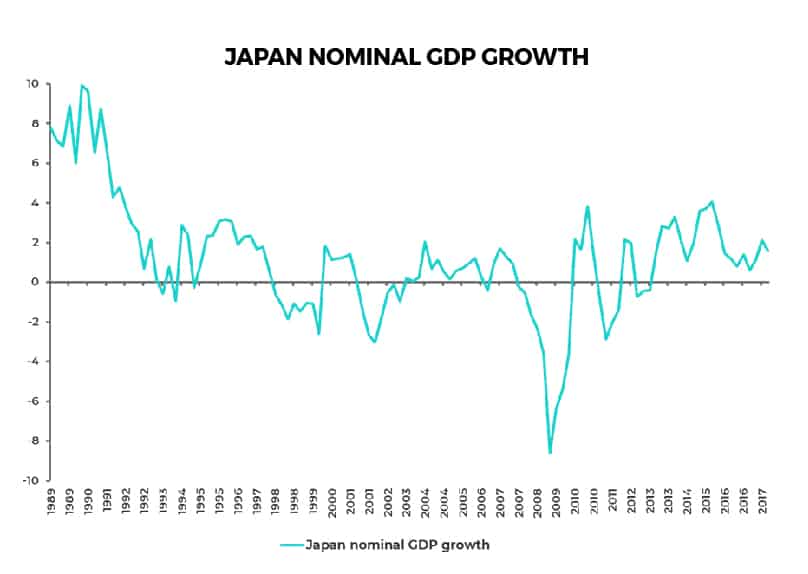
It is also the case that nominal GDP in Japan has now been rising on a year-on-year basis for the past 19 quarters (see following chart). The last time this happened was in the early 1990s. Nominal growth in many respects is more important for investors in stock markets than real GDP growth. This is because companies’ earnings are “nominal” not “real”.
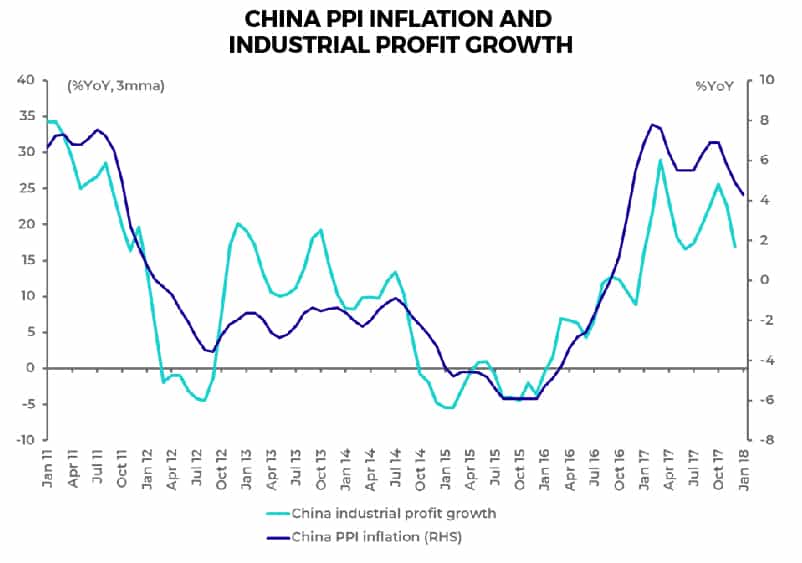
The same point applies in China where, interestingly, there has been a significant 0.78 correlation between nominal GDP growth and Producer Price Index (PPI) inflation since 2002 (see following chart) — domestic producers have experienced stronger pricing power when nominal levels of GDP growth are higher. This has become relevant in recent years since China’s PPI turned positive in 2016 and has stayed positive since then primarily because of the capacity cuts discussed above.
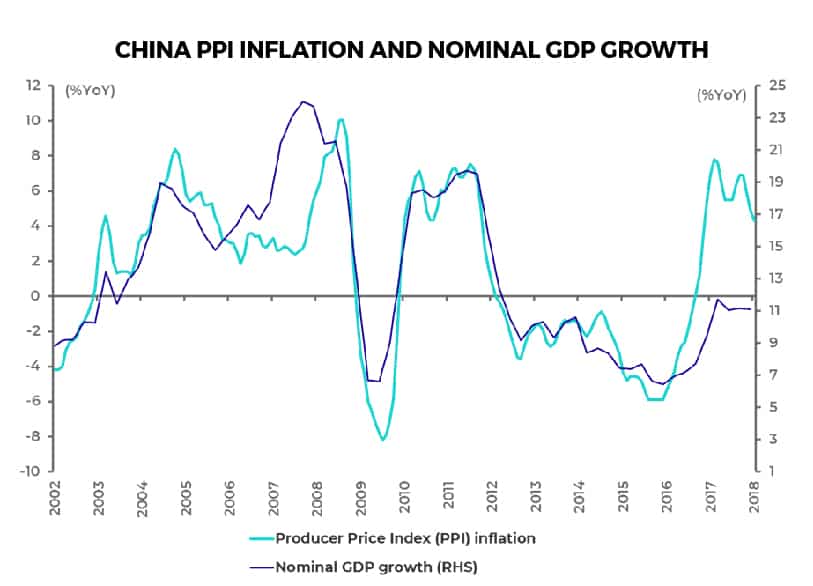
This has led to a commensurate increase in nominal GDP and industrial profits in China. China PPI rose from a negative 5.9%YoY in December 2015 to a recent high of 7.8% in February 2017 and was 4.3%YoY in January 2018. While nominal GDP growth accelerated from 6.4%YoY in 4Q15 to 11.1%YoY in 4Q17 and industrial profit growth rose from a negative 2.3%YoY in 2015 to 8.5%YoY in 2016 and 21%YoY in 2017 (see following chart). Most encouraging of all, PPI looks likely to remain positive this year.
The views expressed in Chris Wood’s column on Grizzle reflect Chris Wood’s personal opinion only, and they have not been reviewed or endorsed by Jefferies. The information in the column has not been reviewed or verified by Jefferies. None of Jefferies, its affiliates or employees, directors or officers shall have any liability whatsoever in connection with the content published on this website.
The opinions provided in this article are those of the author and do not constitute investment advice. Readers should assume that the author and/or employees of Grizzle hold positions in the company or companies mentioned in the article. For more information, please see our Content Disclaimer.