
An interesting contribution to the debate on the impact of Fed balance sheet contraction on emerging markets’ US dollar funding came early last month in the form of an article by Urjit Patel, the governor of the Reserve Bank of India, published in the Financial Times (“Emerging markets face a dollar double whammy” June 4, 2018).
This article argued that the combination of Fed balance sheet contraction and the increase in net Treasury bond issuance to finance the Trump administration’s tax cuts, had created the unintended consequence of a “double whammy”, resulting in dollar funding for emerging markets being “in turmoil”.
The Double Whammy
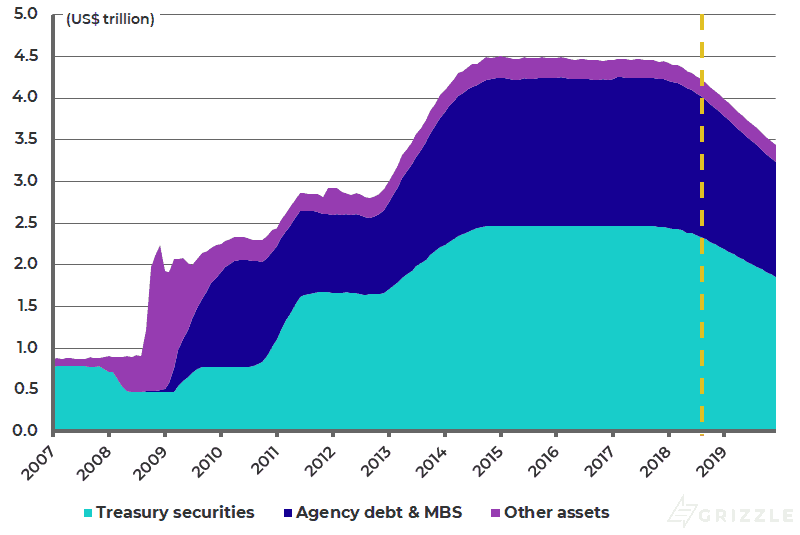
The RBI Governor argued that the rate of Fed balance sheet contraction is at roughly the same pace as the increase in net Treasury bond issuance. The Fed’s current plan is to reduce its debt securities holdings by a cumulative US$1.05 trillion by the end of 2019 (US$30 billion in 4Q2017, US$420 billion in 2018 and a further US$600 billion in 2019, see following chart).
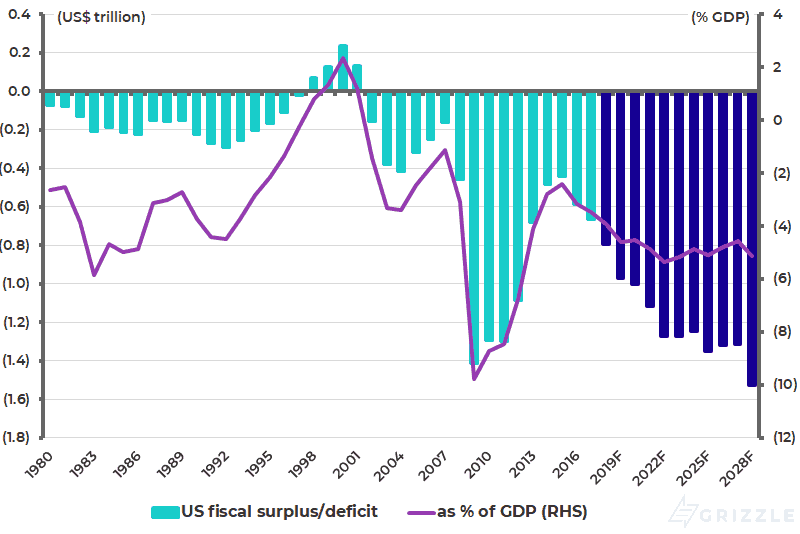
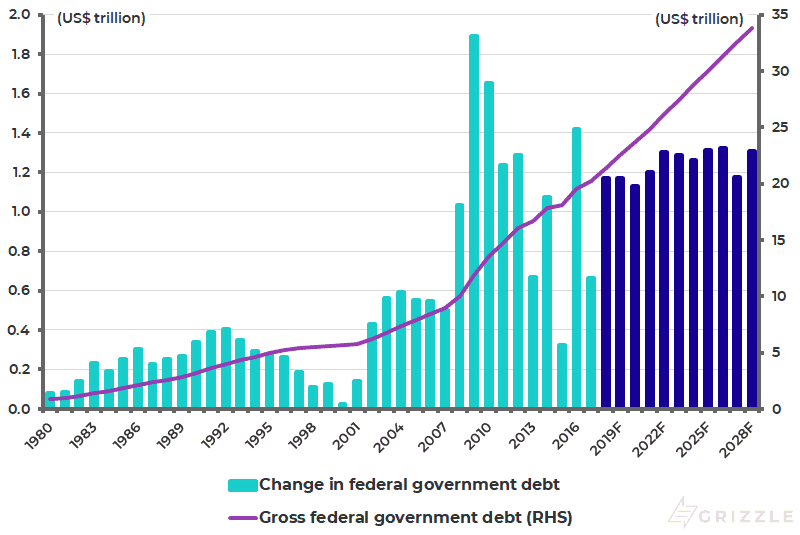
While the US fiscal deficit is projected by the Congressional Budget Office (CBO) to be US$793 billion in this fiscal year ending September 30 and US$973 billion in FY19, implying net issuance of government debt of US$1.17 trillion in each of these two years (see following charts).
Federal Reserve Balance Sheet Reduction Plan
US Fiscal Balance
US Gross Federal Government Debt
In actual fact, based on the above data, the Fed’s planned balance sheet reduction is “only” US$1.05 trillion over a 27-month period compared with a one-year projected increase in federal government debt of US$1.17 trillion. Still such statistical nitpicking aside, Patel uses the above argument to propose that the Fed should now adjust its balance sheet contraction to take account of the increase in net Treasury bond issuance which was not known about when the American central bank originally announced its schedule for quantitative tightening in September 2017, three months before the Trump tax cuts were passed. He wrote: “The Fed has not adjusted to, or even explicitly recognised, the previously unexpected rise in US government debt issuance. It must now do so.”
There is a certain logic to Patel’s argument. But it is extremely unlikely that the Fed will make such an adjustment. For one reason the Fed is raising rates and remains committed to ongoing balance sheet contraction — precisely to offset the risk posed by what most Fed governors view as excessive fiscal stimulus at this point in the American economic cycle.
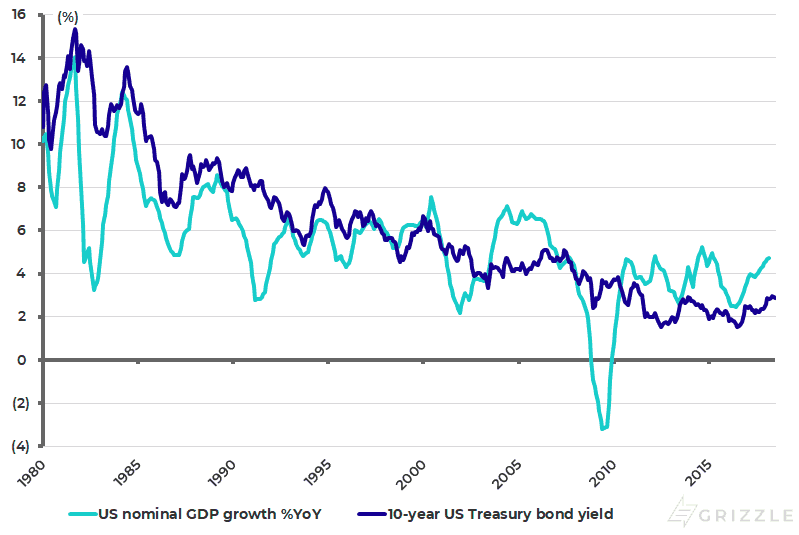
Patel’s argument also implies that rising Treasury bond net issuance, combined with balance sheet contraction, will lead to higher Treasury bond yields. But there is very little evidence that long-term Treasury bonds are influenced by supply considerations with nominal GDP growth trends being the far more important factor.
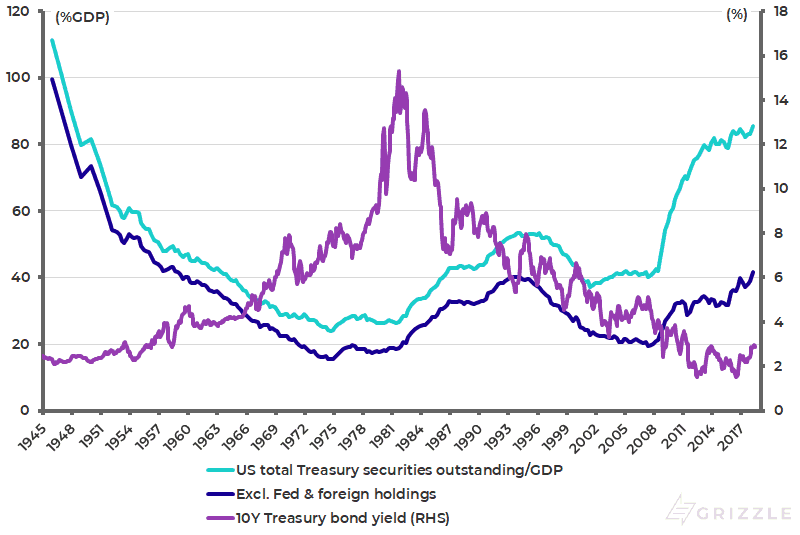
As is clear from the chart below, the last time Treasury bond yields were at the current low levels in the early 1950s, US Treasury securities outstanding as a percentage of GDP was also around the current high level of 80% (see following chart). While the Treasury securities to GDP ratio rose in 1980s, Treasury bond yields were collapsing. By contrast, the correlation between US nominal GDP growth and the 10-year Treasury bond yield has been 0.70 since 1980 (see following chart).
US Treasury Securities Outstanding as % of GDP and 10-year Treasury Bond Yield
US Nominal GDP Growth and 10-year Treasury Bond Yield
It is also the case that quantitative tightening is likely to prove bullish for long-term Treasury bonds because it is another form of monetary tightening, and therefore will result in due course in a slowdown in the economy.
Liquidity a Major Risk for Corporate Bonds
Meanwhile, the Fed would view as an exaggeration Patel’s description of the dollar funding markets as being “in turmoil”. But such turmoil is certainly possible if not probable during this tightening cycle, most particularly if the US dollar rallies further, since foreign governments do not have the luxury, enjoyed by the US, of being able to print dollars.
The potential for turmoil in the fixed income world is also increased considerably by a technical factor. That is the underlying severe lack of liquidity in credit markets, which has been a feature of the fixed income world since the global financial crisis as a result of both post-crisis regulation and the related post-2008 “de-risking” of banks’ balance sheets.
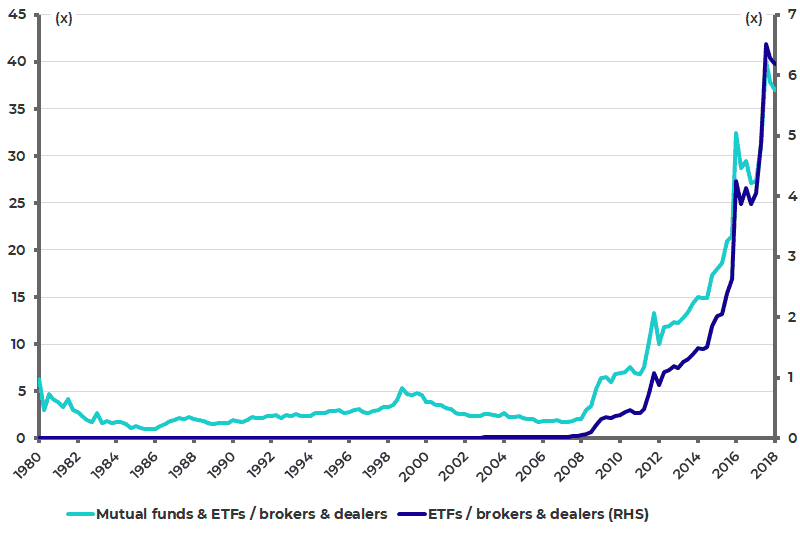
This vulnerability is best highlighted by the chart below which shows, in the US context, the collapse in corporate bonds owned by brokers/dealers relative to the surge in such bonds owned by mutual funds and ETFs. The ratio of US mutual funds’ and ETFs’ holdings of corporate bonds over brokers’ and dealers’ holdings has soared from 1.7x in 2Q07 to 40x in 3Q17 and was 37x at the end of 1Q18, according to the Federal Reserves’ flow of funds data (see following chart).
US brokers’ and dealers’ holdings of corporate bonds have collapsed by 84% from a peak of US$418 billion in 2Q07 to US$59.7 billion in 3Q17, the lowest level since 1Q95, and were US$65 billion in 1Q18. While mutual funds’ and ETFs’ holdings have surged by 240% from US$708 billion in 2Q07 to US$2.41 trillion in 1Q18.
Ratio of US Mutual Funds’ & ETFs’ Holdings of Corporate Bonds Over Brokers & Dealers’ Holdings
But this lack of liquidity is a global phenomenon and not just an American one. It means that when everybody wants to sell the same bond there will be a lack of buyers. And remember bonds, unlike stocks, are not listed on exchanges.
The views expressed in Chris Wood’s column on Grizzle reflect Chris Wood’s personal opinion only, and they have not been reviewed or endorsed by Jefferies. The information in the column has not been reviewed or verified by Jefferies. None of Jefferies, its affiliates or employees, directors or officers shall have any liability whatsoever in connection with the content published on this website.
The opinions provided in this article are those of the author and do not constitute investment advice. Readers should assume that the author and/or employees of Grizzle hold positions in the company or companies mentioned in the article. For more information, please see our Content Disclaimer.