
The past investment quarter has seen rotation into the cyclical value trade in world stock markets after fund managers finally started to shed favoured growth names.
This will not have come easily as one way of investing, namely investing in growth, has worked for so long.
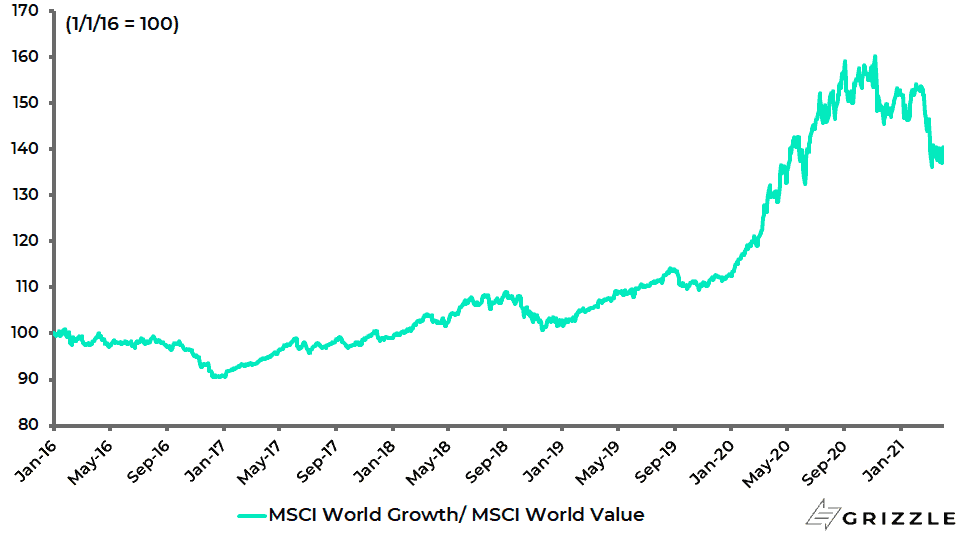
Still, the continuing outperformance of cyclical and value over growth is shown in the chart below.
The MSCI World Growth Index has underperformed the MSCI World Value Index by 8.8% since early February on a total-return basis and by 12.4% since early November.
MSCI World Growth Index relative to MSCI World Value Index
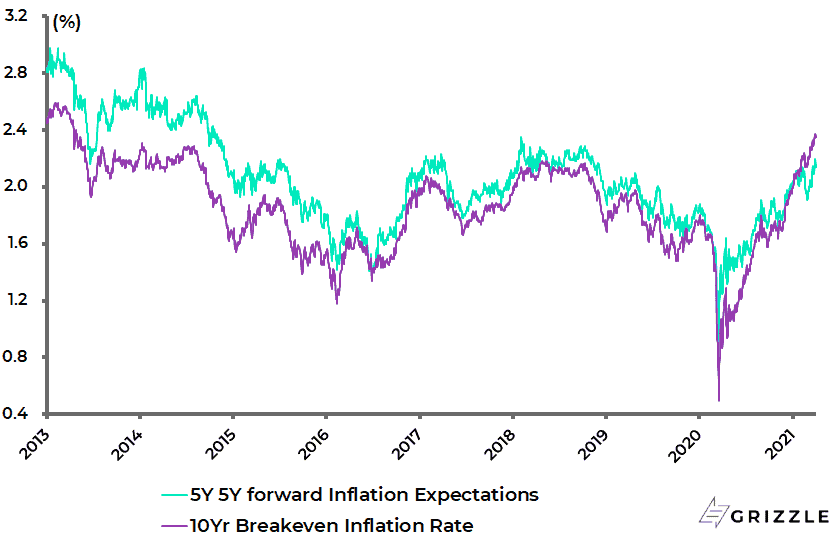
Meanwhile, inflation expectations are back at recent highs.
The US 5-year 5-year inflation expectations rate rose by 29bp from a recent low of 1.91% in late February to 2.20% at the end of last quarter, the highest level since November 2018, and is now 2.14%.
While the US 10-year breakeven inflation rate rose by 23bp from 2.14% in late February to 2.37% at the end of March, the highest level since April 2013, and is now 2.36%.
US Inflation Expectations
Meanwhile, a further rise in bond yields is just the sort of action that would cause the doves on the Fed to argue for yield curve control.
Interestingly, a speech delivered in March by Federal Reserve Governor Lael Brainard, who is a potential candidate to replace Powell next February when his term in office expires, did acknowledge that “transitory inflationary pressures are possible if there is a surge of demand that outstrips supply in certain sectors when the economy opens up fully”.
But Brainard, a prominent dove, also noted that such a burst of transitory inflation seemed “more probable” than what she described as an “unmooring of inflation expectations to the upside”.
A surge in demand that outstrips supply on the other side of the epidemic is exactly what this writer is expecting.
Staying on this cyclical theme, it has been the experience here that bottom-up analysts have a pronounced tendency to underestimate operating leverage in corporate earnings when the cycle turns.
This is likely to be even more the case in the unprecedented context of the pent-up demand triggered by exiting a pandemic.
The kind of cyclical sectors with high correlation between top-line revenue growth and nominal GDP are autos, capital goods and commodities.
Meanwhile, comparisons with previous cycles, such as the post-2008 recovery after the global financial crisis, may understate what is coming because of the unusual circumstances created by the pandemic, and the resulting dramatic potential for a surge in pent-up demand.
It is also the case that from a macro monetary and credit standpoint, the conditions in the G7 world are very different now because broad money supply, and related credit growth, never really picked up convincingly coming out of the global financial crisis, in stark contrast to the present circumstances.
One major reason for this is that there is not the same deleveraging dynamic as was clearly a factor at work in 2008, be it banks hoarding capital or US households increasing their savings rate in the context of the then collapsing housing market.
Consider the contrast with this cycle.
Savings rates have risen almost everywhere in the G7 world not because house prices collapsed but because economies were locked down and, as a consequence, household deposits have surged; a process also driven by a surge in transfer payments, with more to come in the case of America in the context of the Biden administration’s recently enacted US$1.9tn Covid stimulus.
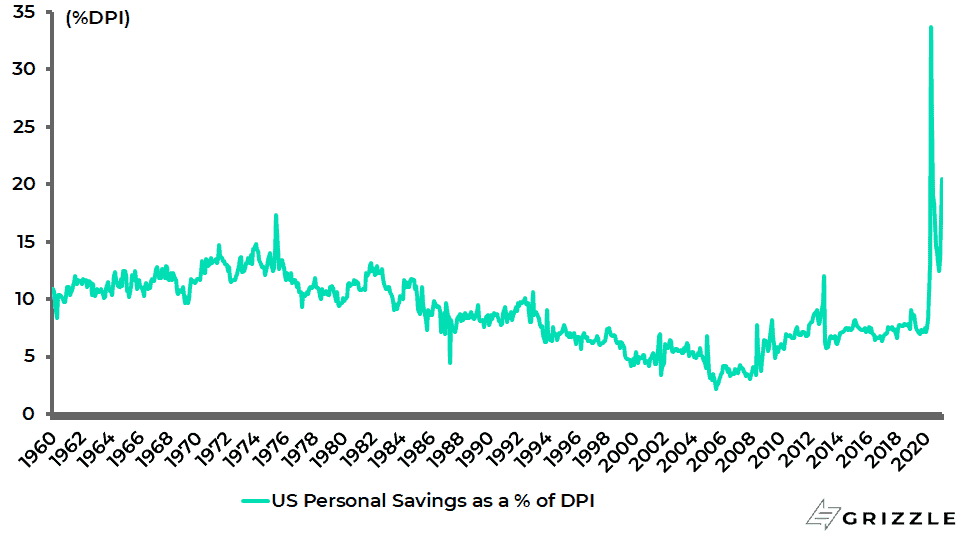
Thus, the US personal savings rate rose from 7.2% of disposable income in December 2019 to 33.7% in April 2020 and was still an elevated 13.6% in February.
US Personal Savings as % of Disposable Income
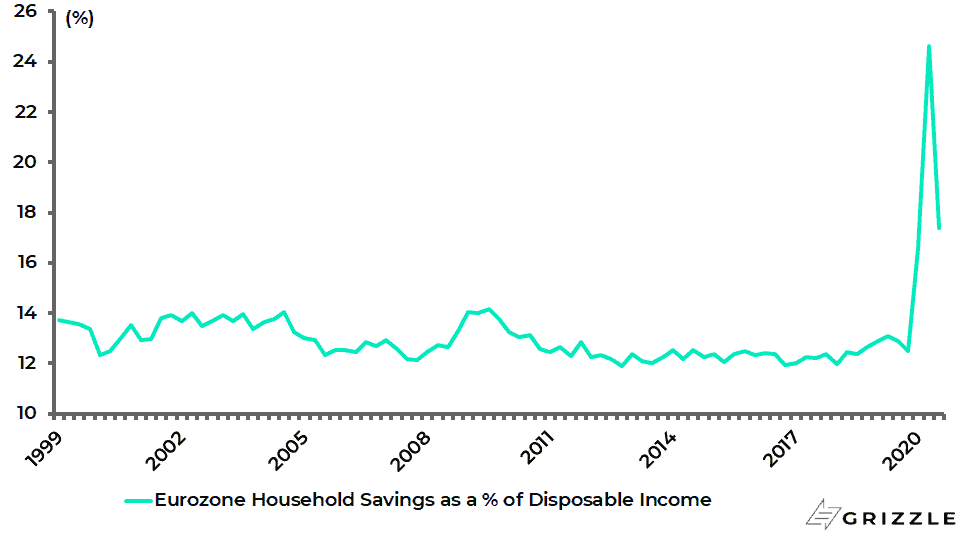
While the household savings rate in the Eurozone rose to 24.6% in 2Q20 and was still 17.4% in 3Q20, the latest data available.
Eurozone Household Savings as % of Disposable Income
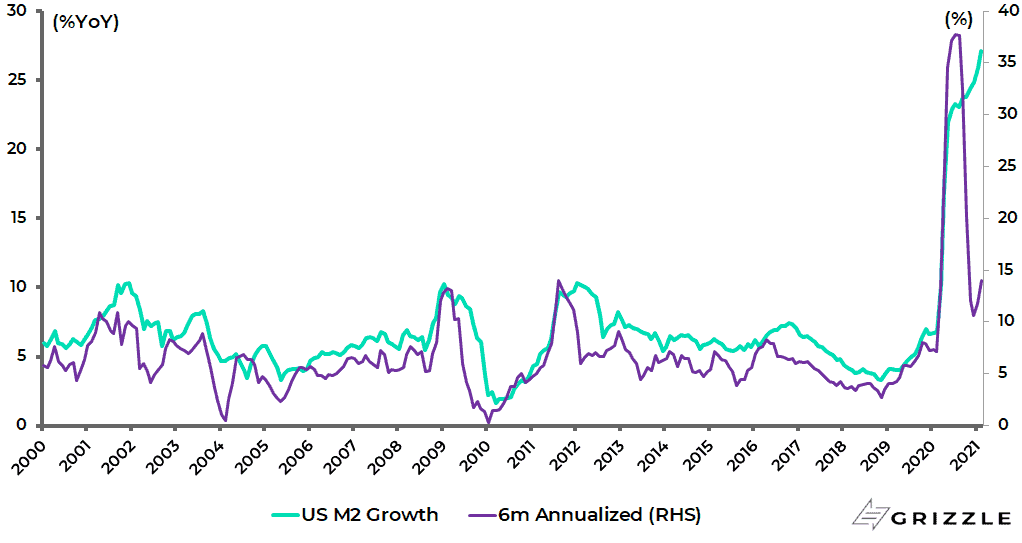
Meanwhile, if broad money supply growth has slowed on a six-month annualised basis, M2 growth in the US is still on course to grow by 12% this year.
That is still twice the average growth rate of 6% recorded between 2000 and 2019. US M2 growth is now running at a 14% six-month annualised rate and 27% YoY in February.
US M2 Growth
This consensus expectation is that the Fed will commence a gradual tapering, in terms of reducing its monthly purchases of bonds at the current rate of US$120bn, at the start of 2022 with the process completed by the end of next year before so called interest rate “lift off” in 2023.
If this is the consensus outlook, the key variable to monitor remains rising inflation expectations, since it is a rise in market-driven inflation expectations which has the potential to bring forward a tapering scare.
For, as already noted, if inflation expectations rise above 2.5%, it will become that much harder for the Fed to ignore in the sense that the market will become focused on the degree of overshoot to be tolerated by the American central bank.
The views expressed in Chris Wood’s column on Grizzle reflect Chris Wood’s personal opinion only, and they have not been reviewed or endorsed by Jefferies. The information in the column has not been reviewed or verified by Jefferies. None of Jefferies, its affiliates or employees, directors or officers shall have any liability whatsoever in connection with the content published on this website.
The opinions provided in this article are those of the author and do not constitute investment advice. Readers should assume that the author and/or employees of Grizzle hold positions in the company or companies mentioned in the article. For more information, please see our Content Disclaimer.