
Foreign Investors Still Exiting Japan Despite Cyclical Tailwinds
Foreign investors continued to be net sellers of Japanese stocks last quarter despite the rally in cyclical stocks which benefited Japan. The materials, industrials, consumer discretionary, financials and real estate sectors account for 56% of the MSCI Japan, higher than the cyclical component of the American and European benchmarks. Yet foreigners sold a net ¥1.85tn worth of Japanese equities last quarter. They have now sold a net ¥4.49tn year-to-date (see following chart).
Foreign net buying of Japanese stocks
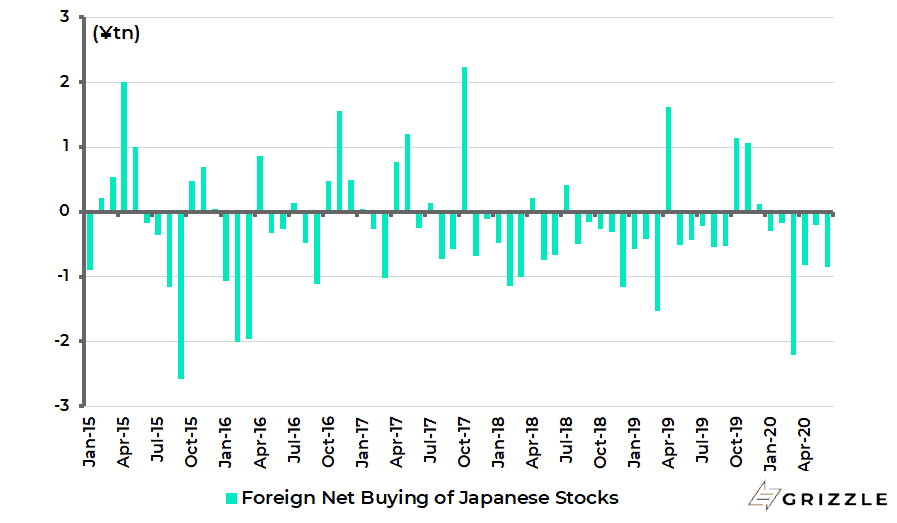
The above is why the Japanese market, given its external gearing, should be as good a stock market as any to own globally if and when investors become truly confident that the health crisis is over and embrace a V-shaped recovery thesis.
The Japanese Market is Cheap and COVID-19 is Less Deadly than in America
The investment case for Japan, fundamentally, should also be superior since this market commenced the sell-off at a much cheaper valuation level than America, while the virus has remained relatively less out of control than in America.
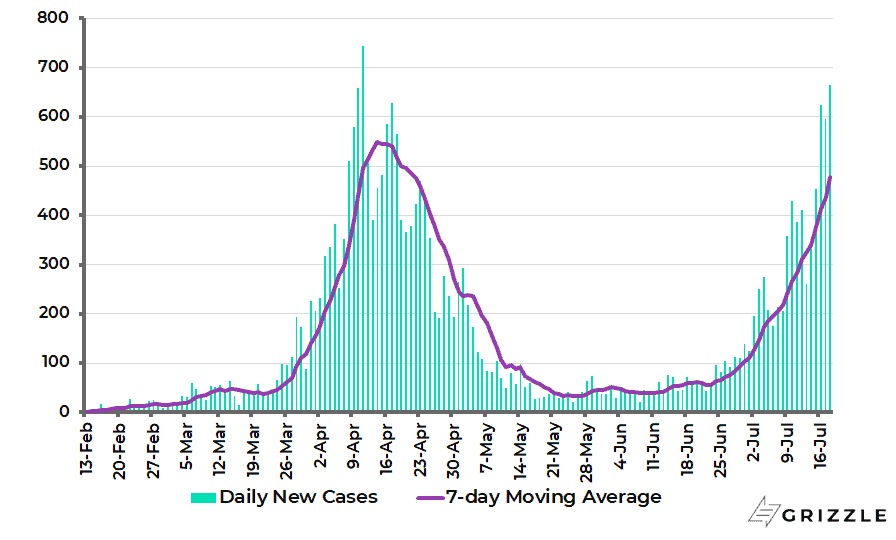
The number of daily new cases in Japan peaked at 743 in mid-April, though it has since risen to 664 on 18 July (see following chart). The cumulative number of cases and deaths in Japan are now 24,642 and 985 respectively, or 194 and 7.8 per 1m of population. This compares with 11,279 cases and 426 deaths per 1m of population in America. Meanwhile Japan has never had an across-the-board lockdown.
Japan Daily Covid-19 Cases
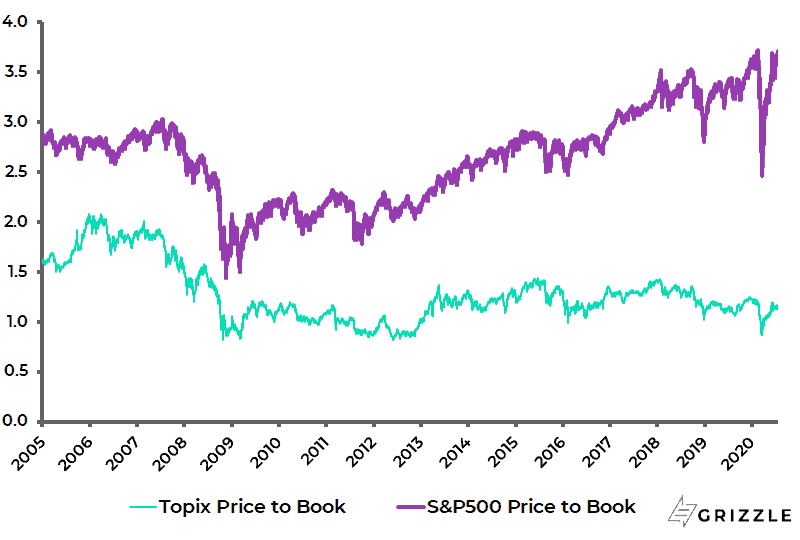
As regards stock valuations, prior to the commencement of the sell-off in February the Topix was trading at 1.22x trailing book, compared with 3.72x for the S&P500 (see following chart) while the MSCI Japan was then trading at 14.5x forward earnings, compared with 19.6x for the MSCI USA Index.
This is in the context of Japanese consensus earnings declining by 26.7% in the fiscal year which ended 31 March and projected to decline by 1.6% in the current fiscal year.
Topix and S&P500 trailing price to book
Japanese Institutional Investors Are Missing in Action
If foreigners have remained net sellers, the Japanese stock market has also been the victim as ever of a continuing lack of domestic institutional investor support.
Still retail investors have, as elsewhere, led the rally which commenced in March, opening reportedly more than half a million online brokerage accounts in the months of March and April. For the six brokers which disclose quarterly data, the total number of new accounts rose from 404,000 in 4Q19 to 677,000 in 1Q20. While individuals have bought a net ¥1.69tn worth of Japanese stocks year-to-date, according to the Japan Exchange Group.
It remains this writer’s base case that Japan’s domestic institutional investors will only return to their own stock market in size when they conclude that the bull market in Japanese government bonds has finally ended.
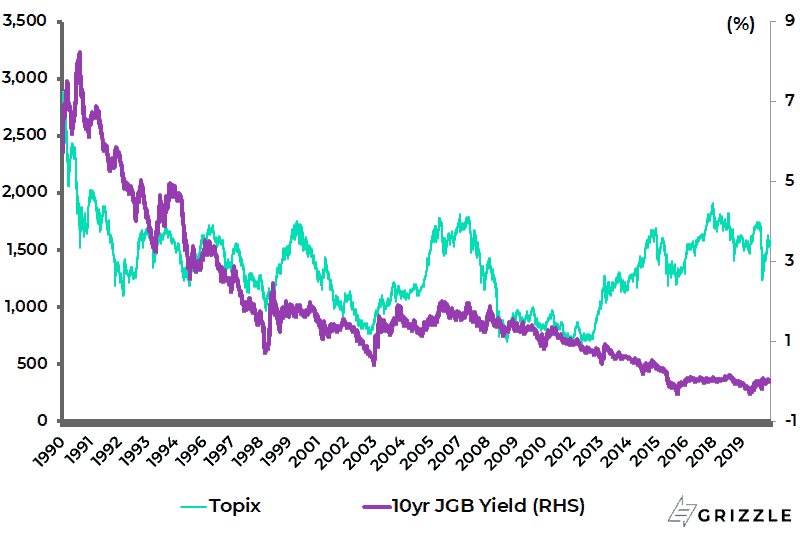
That is because JGBs have outperformed equities since the collapse of the so-called Bubble Economy in 1990. To be precise, the Topix has declined by 45% since the start of 1990, while the 10-year JGB yield has declined from a peak of 8.23% in September 1990 to 0.024% currently (see following chart). This represents an 83% capital appreciation in the value of a JGB.
Topix and 10-year JGB yield
Japanese Bonds Have Offered Little Investor Protection During COVID-19
Still if that is the history over a 30-year period, it also remains the case that JGBs proved to be far less of a hedge against falling share prices in the recent Covid-19-triggered sell-off, while clearly they have underperformed in the stock market rally off the March low.
The Topix declined by 31% from early February to the low reached in mid-March, while the 10-year JGB yield declined from -0.02% in early February to a low of -0.16% on 9 March but was 0.02% in mid-March when the Topix bottomed. It is now 0.024%, while the Topix has rallied by 31% off the March low.
This demonstrates how so-called risk parity strategies break down under yield curve control regimes. And Japan has had such a regime in place since September 2016, in the sense that the 10-year JGB yield has been pegged by the Bank of Japan at around 0%.
Topix Dividend Yield is Very Attractive Relative to Japanese Bonds
The other point is the continuing support for the stock market from Japanese dividend payouts. The consensus 12-month forward Topix dividend yield, at 2.64%, is now 262bp higher than the 10-year JGB yield (see following chart).
Topix 12m forward dividend yield and 10-year JGB yield
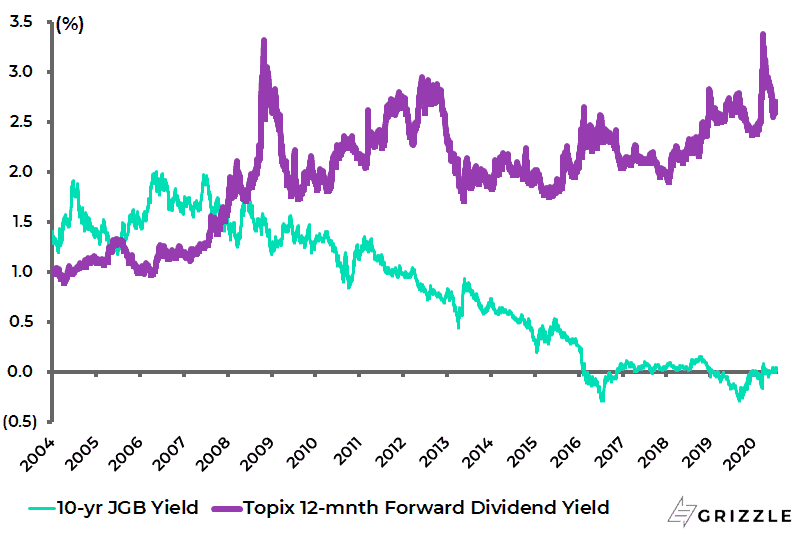
With the Japanese economy projected by the consensus to contract by 5% in 2020, there is a legitimate concern that dividends will be cut as much as earnings. Still given the enormous ¥514tn (US$4.8tn) of cash sitting on listed companies’ balance sheets, this writer’s expectation is that dividends will prove more resilient than earnings.
Fire Hose Fiscal Stimulus Will Continue to Move Japan Out of Deflation
It is also a positive that the Bank of Japan has refrained from increasing negative rates, presumably because of an understanding of the adverse consequences of such a policy. There has been the by now obligatory Covid-19-triggered mega fiscal stimulus with the Abe government having announced in April a ¥117tn package or around 20% of GDP.
One novel aspect of this stimulus is handing out ¥100,000 to every person in Japan, including children and foreign residents. The Abe cabinet also announced in late May another ¥117tn (20% of GDP) of stimulus measures, including financing help for struggling companies, subsidies for firms to make rent payments and health care assistance. The government will also give ¥200,000 to each medical worker treating Covid-19 patients.
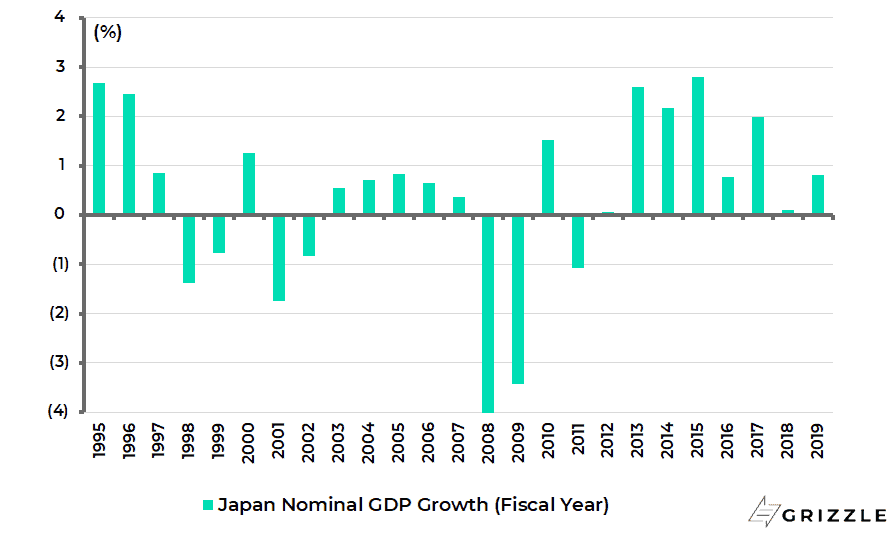
Still amidst the usual focus on easing policies in the context of the virus triggered downturn, it is important to note that Japan has for some time been showing growing evidence of moving out of deflation. Indeed nominal GDP growth has been positive for 25 of the past 28 quarters and for all of the past eight fiscal years (see following chart).
Japan nominal GDP growth
This is why Japan’s deflation trend is not as bad as it is still seemingly perceived to be by many. One reason why is that real interest rates have been negative for most of the time since 2014, in terms of the real 10-year JGB yield deflated by core-core CPI inflation. The real 10-year JGB yield averaged a negative 0.38% since 2014 and is now -0.18% (see following chart).
Real 10-year JGB yield (deflated by core-core CPI)

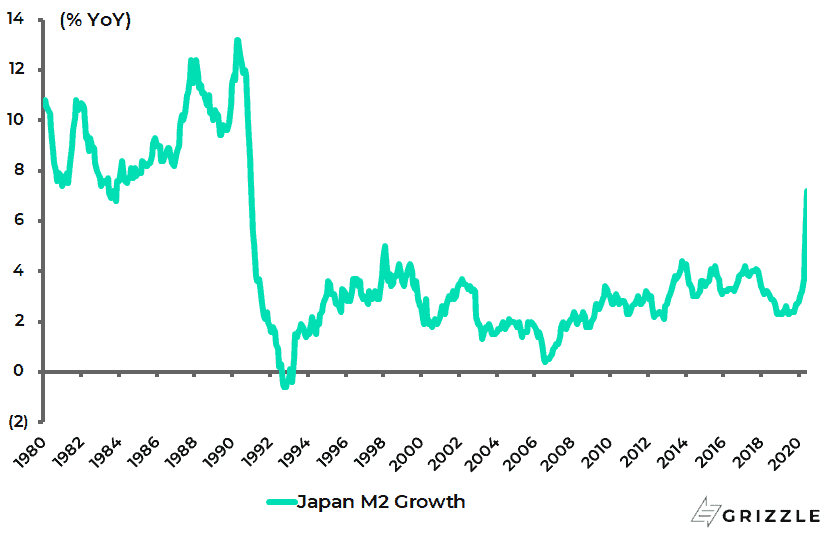
It is also encouraging that M2 is now growing at its fastest rate since the early 1990s. M2 growth rose from 2.8% YoY in January to 7.2% YoY in June, the fastest growth since January 1991 (see following chart).
Japan M2 growth
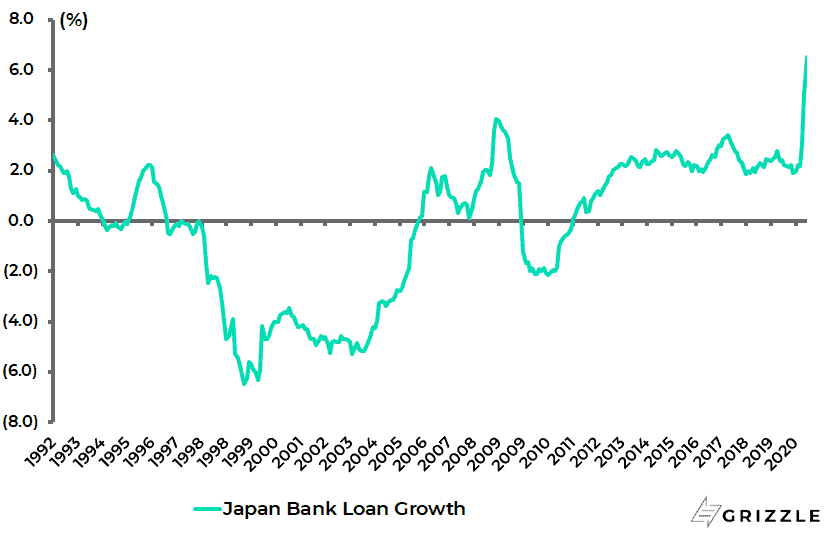
Bank loan growth also remains in a rising trend, accelerating from 1.9% YoY in December to 6.5% YoY in June, the highest growth rate since the data series began in 1992 (see following chart).
Japan bank loan growth
It is also a positive, from a reflationary standpoint, that the share of wages in national income has been rising in Japan in recent years reflecting the tightening labour market courtesy of the ageing demographics. This should remain the case once the health crisis has passed. Annualised compensation of employees as a percentage of nominal GDP has risen from 49.6% in 2015 to 52.5% in 1Q20, the highest level since 1994 (see following chart).
Japan compensation of employees and corporate profits as % of GDP
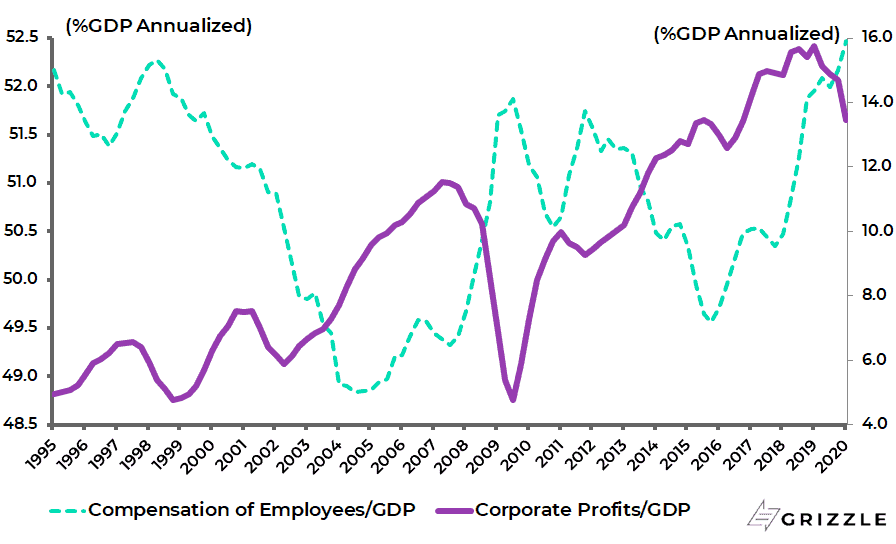
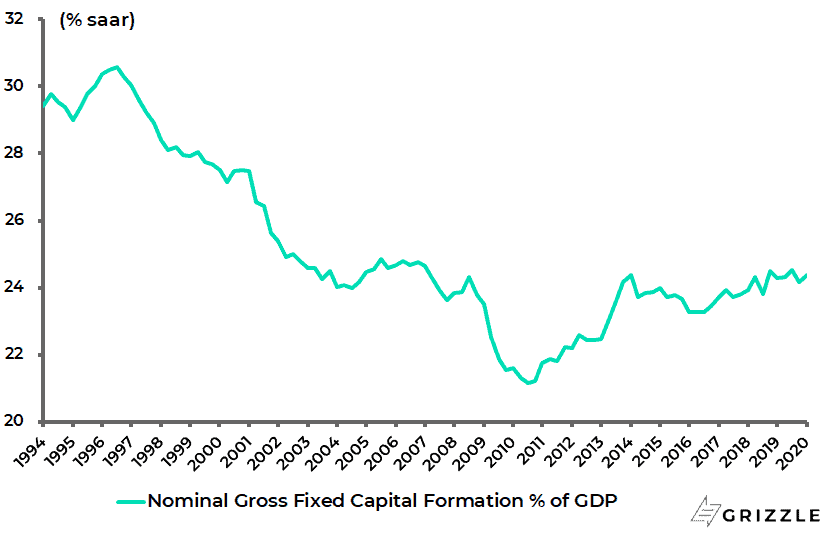
True, corporate profits as a share of nominal GDP have declined as a consequence but they still remain high in absolute terms. Annualised corporate profits as a share of GDP declined from a peak of 15.8% in 1Q19 to 13.4% in 1Q20, the lowest level since 4Q16. This means that the current capex cycle should also remain intact once the pandemic has abated. The gross fixed capital formation to nominal GDP ratio has risen from 21.2% in 4Q10 to 24.4% in 1Q20 (see following chart).
Japan gross fixed capital formation as % of nominal GDP
It is also positive that, despite the health crisis, listed companies have announced ¥3tn worth of share buybacks so far in 2020. This compares with ¥8tn in 2019, which was an all-time high. Unlike the American leveraged share buyback model, which is now under threat for both financial and regulatory reasons, Japanese listed corporates have the financial means to continue buybacks given that, as already noted, they are wallowing in cash.
The views expressed in Chris Wood’s column on Grizzle reflect Chris Wood’s personal opinion only, and they have not been reviewed or endorsed by Jefferies. The information in the column has not been reviewed or verified by Jefferies. None of Jefferies, its affiliates or employees, directors or officers shall have any liability whatsoever in connection with the content published on this website.
The opinions provided in this article are those of the author and do not constitute investment advice. Readers should assume that the author and/or employees of Grizzle hold positions in the company or companies mentioned in the article. For more information, please see our Content Disclaimer.