

The past year was a disastrous year for investors in the sense that U.S. dollar cash outperformed all stock markets and most bond markets and, so far at least, 2019 has not got off to the best of starts.
This is not a comforting trend for those who invest passively in indices or ETFs without any real knowledge of the underlying shares they are investing in, and this unfortunately has been the fad for the past ten years.
This ignorance of what they actually own means that investors will have little conviction to hold on when markets start going down, as has been the trend of last quarter, raising the risk of a selling panic.
Meanwhile, the fundamental reason stock markets have been going down is U.S. monetary tightening which consists of both interest rate hikes and Federal Reserve balance sheet contraction.
The Effect of Monetary Tightening
How resilient is the American economy to monetary tightening? The base case here has been that the American economy reverts to trend growth in 2019 following last year’s tax cut-driven acceleration. This would suggest a growth rate of 2.2%, which is the average growth rate since the recovery began in 2009 prior to the Trump tax cut last year.
Still, the risk of an uglier outcome (i.e. a recession) rises the more asset prices decline. This is because, in a post-quantitative easing world, the normal causality taught in economic textbooks has reversed. By which is meant that asset prices now drive economies rather than the reverse.
This has now become a highly-relevant point for investors, as asset prices declined last year as Federal Reserve quantitative tightening kicked in. The Fed’s balance sheet contracted by US$373 billion in 2018. Investors should not assume this is a coincidence. And for now at least the Fed’s quantitative tightening is set to continue at a pace of US$50 billion a month.
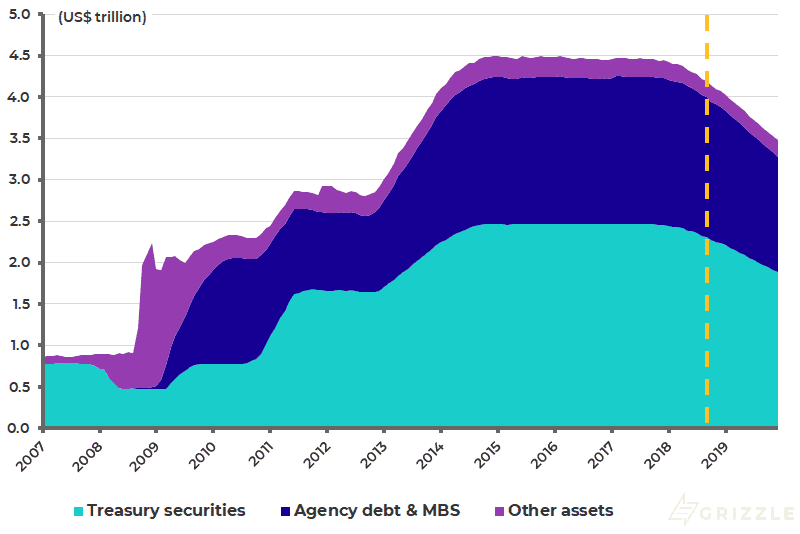
The Fed’s balance sheet has already shrunk by US$413 billion since September 2017, a decline of 9.2% since the balance-sheet contraction began in October 2017. At its peak, the balance sheet totalled US$4.5 trillion. If the Fed continues to shrink the balance sheet by the scheduled US$50 billion a month during the coming year, it will have declined by a further 14.7% by the end of 2019 (see following chart).
Federal Reserve balance sheet contraction plan
In such a context of accelerating tightening, credit spreads now need to be watched closely for signs of rising stress in the system. For they will be the signal of an uglier decline in asset prices than just a correction of stock market excesses, in terms of a derating of high PE growth stocks.
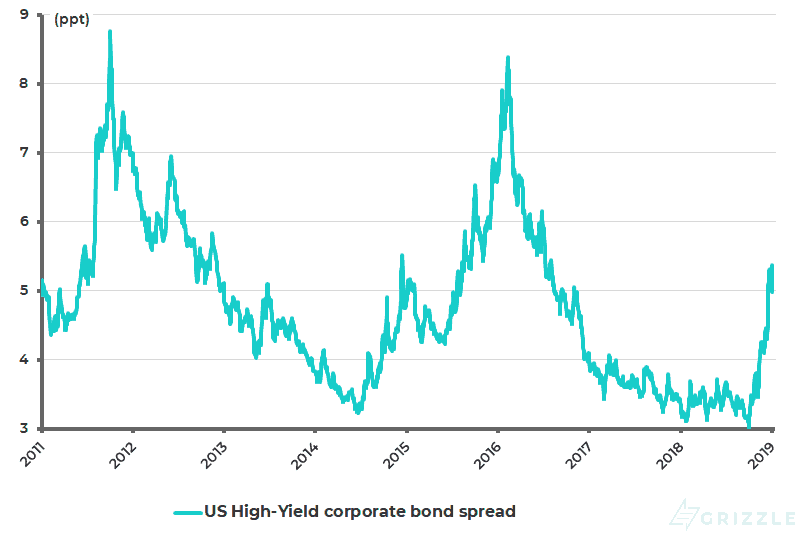
And indeed 2018 ended with credit markets beginning to price these risks. Thus, spreads on US high-yield bonds over the 10-year Treasury bond have risen by 228bps since early October to 531bps in late December, the highest level since August 2016, and are now 498bps (see following chart).
The past year also ended with reports of credit markets tightening up as it suddenly became difficult, if not impossible, to finance high-yield bonds or so-called leveraged loans. Indeed, there was seemingly not a single high-yield financing by a U.S. corporate in December. The last month this was the case was November 2008.
U.S. High-Yield corporate bond spread
Such market action, in terms of rising credit stresses, strongly suggest that an end is nearing to the monetary tightening cycle in the U.S. Yet the so-called “dot plots” incorporating Fed governors’ interest rate forecasts still suggest 50bps of tightening in 2019 and 25bps in 2020. This looks unlikely in the extreme.
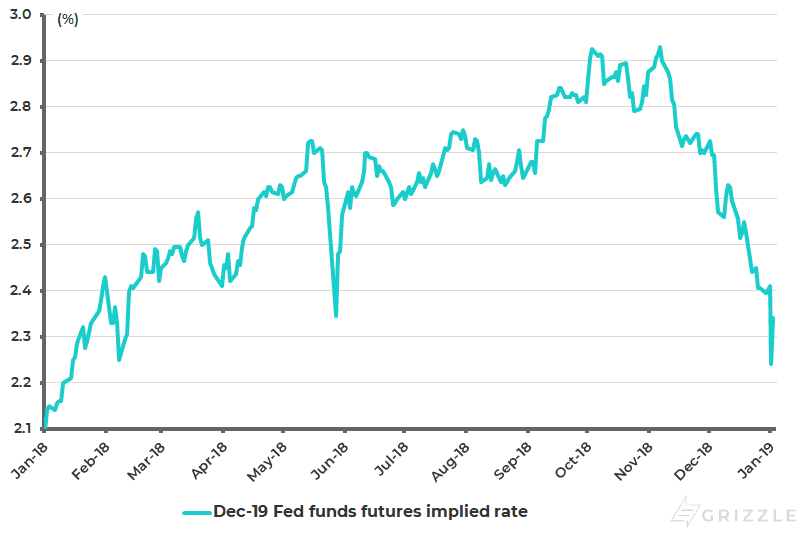
Rising credit spreads, if not correcting FANG stocks, are increasingly likely to get the attention of the Fed, regardless of Fed chairman Jerome Powell’s comments at his December press conference about the balance sheet contraction being on “autopilot”. Meanwhile, in the money markets the implied rate of the December 2019 Fed funds futures has already fallen from 2.93% in early November to 2.34% at present, implying no further tightening whatsoever (see following chart).
December 2019 Fed funds futures implied rate
The State of U.S. Stocks in 2018
What about the American stock market? Having diverged from the weakening trend in other stock markets in the first three quarters of last year, there was a lot of room for the American stock market to play catch up on the downside. This is what happened in the final quarter of 2018.
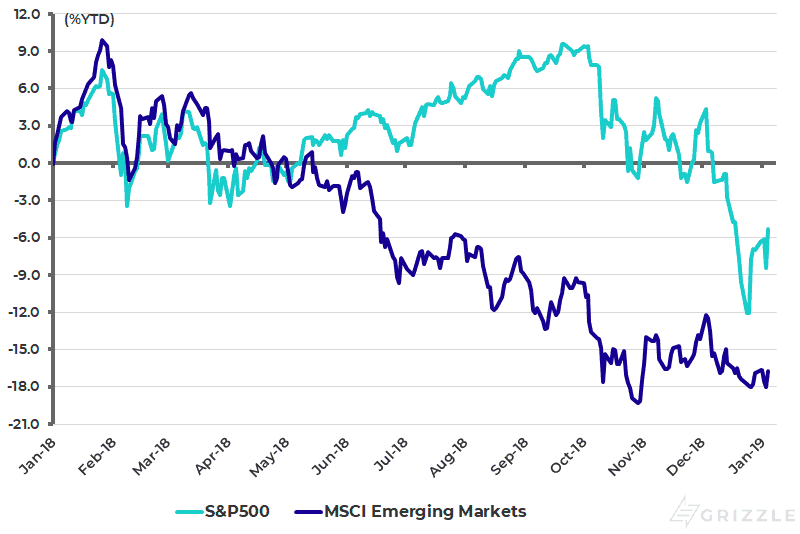
The S&P500 declined by 14% in 4Q18, compared with a 7.8% decline in the MSCI Emerging Markets (see following chart). There is now a risk of extreme American underperformance if potential turmoil in the credit markets causes American equity investors finally to take a more critical look at years of financial engineering financed by leverage in corporate America. This has resulted in a dramatic collapse in tangible book value for the S&P500, which has fallen by 22% since June 2014.
S&P500 and MSCI Emerging Markets
From a more mundane earnings standpoint, there is also a growing risk both short-term and long-term for the U.S. stock market.
The short-term risk is the unhelpful base effect given the tax reform-driven surge in U.S. corporate profits in the first half of last year. S&P500 as-reported earnings rose by 23% YoY in 1H18.
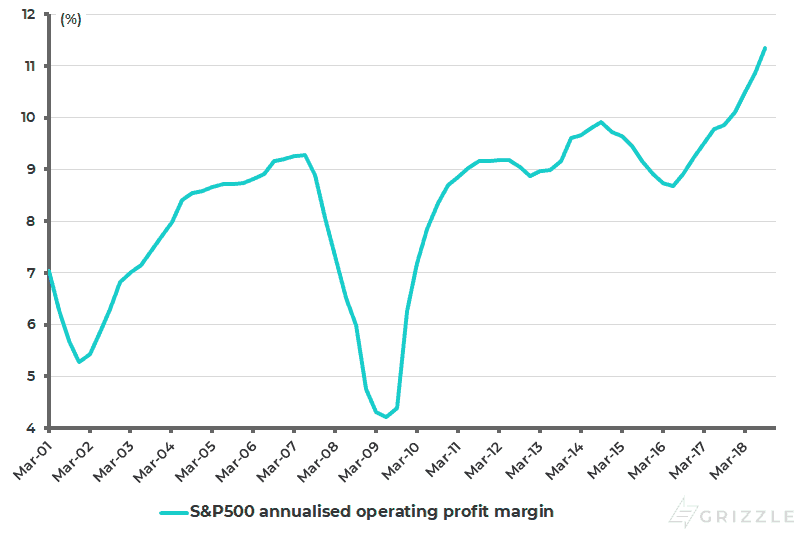
The longer-term risk is that U.S. corporate profit margins are at a record high, even after adjusting for last year’s tax cut, and look like they are peaking. The S&P500 operating profit margin has risen from 8% in 4Q15 to a record 12.1% in 3Q18 and an annualized 11.3% (see following chart).
S&P500 annualized operating profit margin
Rising Wage Costs Leading to Profit Margin Peak
This risk of peaking profit margins is especially the case given the rising ‘late cycle’ costs facing U.S. corporations, in particular rising wage costs as reflected in the fact that the past three months have seen the biggest year-on-year rise in average hourly earnings growth since April 2009.
Average hourly earnings growth rose from 2.8%YoY in September to 3.1%-3.2%YoY in October-December (see following chart). The evidence that wage pressure is finally picking up in America nearly 10 years after the recovery began is viewed here as more of a threat to profits, and therefore to stocks, than as a harbinger of a pickup in inflation.
U.S. average hourly earnings growth

Slowing Growth in U.S. a Boon for Emerging Markets
Meanwhile, the increasing market signals of slowing growth, or worse, in America have a silver lining for Asia and other emerging markets. That is because it raises the prospects of not only an end to Fed tightening but also an end to US-dollar strength, given the continuing negative correlation between a strong dollar and Asian and emerging markets.
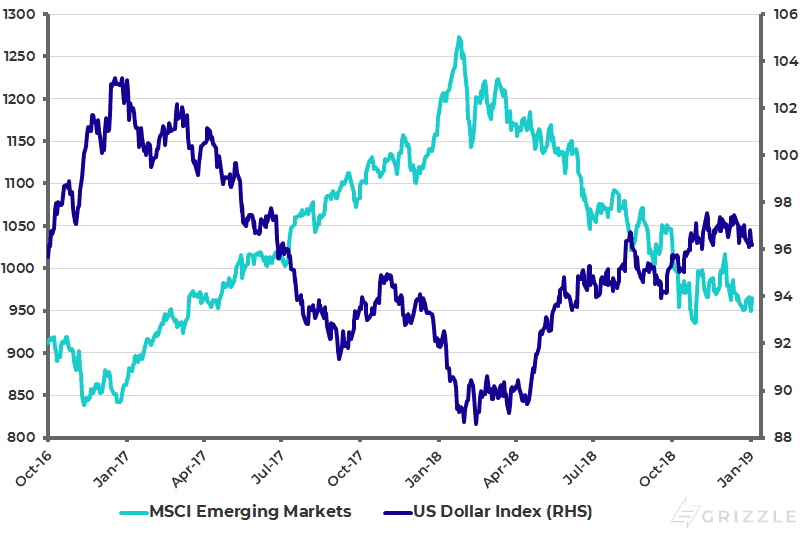
The correlation between the US Dollar Index and the MSCI Emerging Markets has been a negative 0.92 since 4Q16 (see following chart). It is also the case that there is significant room to ease monetary policy in many parts of Asia if Fed tightening ends and, with it, US-dollar strength. This is both because of a lack of inflationary pressures, as well as the willingness of Asian central banks to raise rates this cycle just to defend their currencies regardless of domestic growth considerations.
U.S. Dollar Index and MSCI Emerging Markets
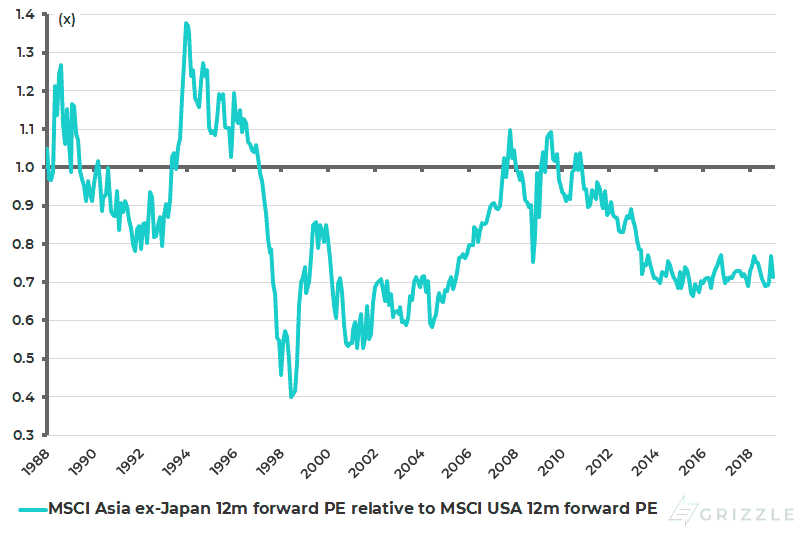
This leads to the recommendation to overweight Asian equities in an asset allocation for 2019. Asian stocks are certainly cheap, both relative to other markets and in absolute terms. The MSCI AC Asia ex-Japan Index now trades at 11.1x one-year forward earnings or a 29% discount to the American market (see following chart).
MSCI Asia ex-Japan 12m forward PE relative to MSCI USA 12m forward PE
Gold Poised to Benefit from an End to Tightening
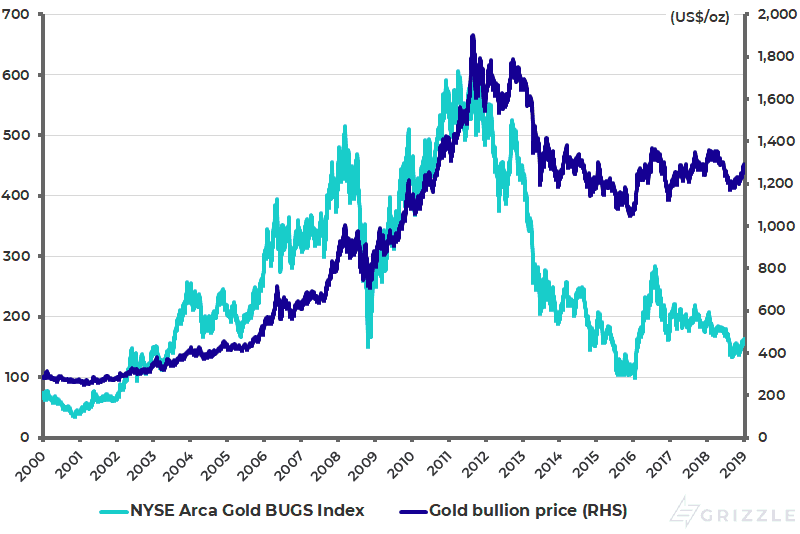
The other asset which would benefit from an end to Fed tightening is gold. The gold-bullion price rose by 7.5% last quarter as Fed tightening expectations collapsed. As a result, gold was down only 1.6% in 2018. This followed the 13.1% rally in gold in 2017. Meanwhile, the unhedged gold-mining index of gold mining stocks outperformed gold bullion last quarter, rising by 13.8%. But it was still down 16.5% for the whole of 2018 (see following chart).
Still, the really positive trigger for gold will be renewed Fed easing. And gold-mining stocks remain the geared way of investing on such a Fed U-turn. They are now trading at July 2003 levels when the gold price was around US$360/oz, compared with the current price of US$1,285/oz.
Gold bullion price and gold mining stock index
The views expressed in Chris Wood’s column on Grizzle reflect Chris Wood’s personal opinion only, and they have not been reviewed or endorsed by Jefferies. The information in the column has not been reviewed or verified by Jefferies. None of Jefferies, its affiliates or employees, directors or officers shall have any liability whatsoever in connection with the content published on this website.
The opinions provided in this article are those of the author and do not constitute investment advice. Readers should assume that the author and/or employees of Grizzle hold positions in the company or companies mentioned in the article. For more information, please see our Content Disclaimer.