
The June US CPI data came in well above consensus while the July data, released last week, still shows CPI and core CPI rising at 5.4% YoY and 4.3% YoY.
US CPI inflation

An interesting technical point as regards the inflation data is that the rental component of CPI, known as shelter, rose by 0.5% MoM in June, the highest level since October 2005, and was up 0.4% MoM in July.
US Shelter CPI
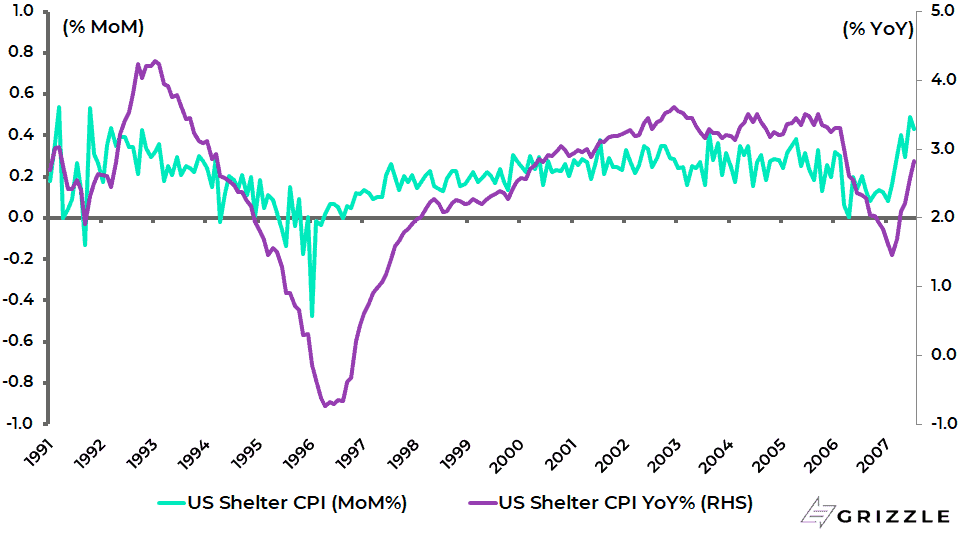
This is significant since shelter is the biggest component of CPI accounting for 32.6%.
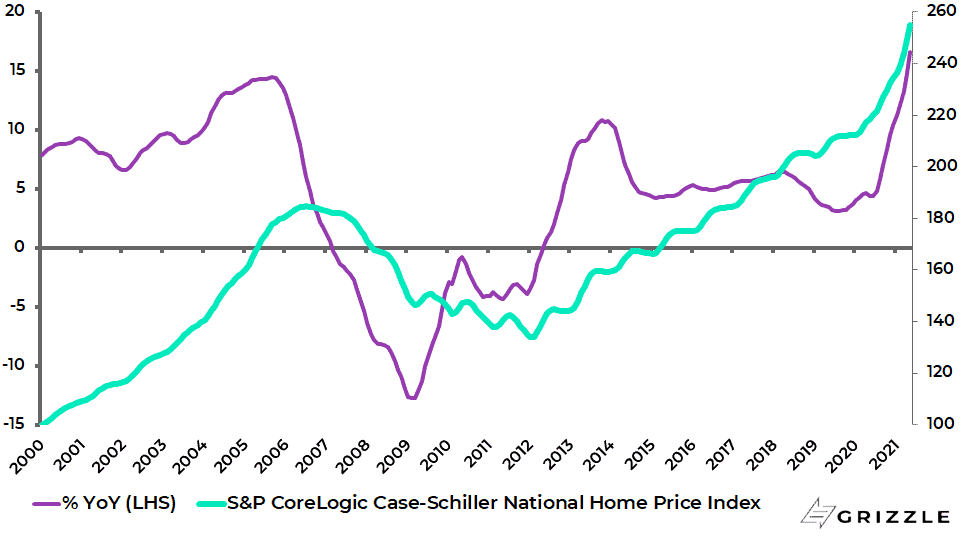
Rising rents make sense since the pandemic triggered a surge in house prices, with the Case-Shiller Home Price Index up 19.1% since the start of 2020 and up 16.6% YoY in May, should increase the demand to rent as houses have become less affordable.
S&P CoreLogic Case-Shiller US Home Price Index
The owners’ equivalent rent rose by 0.32% MoM in June, the largest increase since April 2019, and was up 0.29% in July.
US owners’ equivalent rent CPI
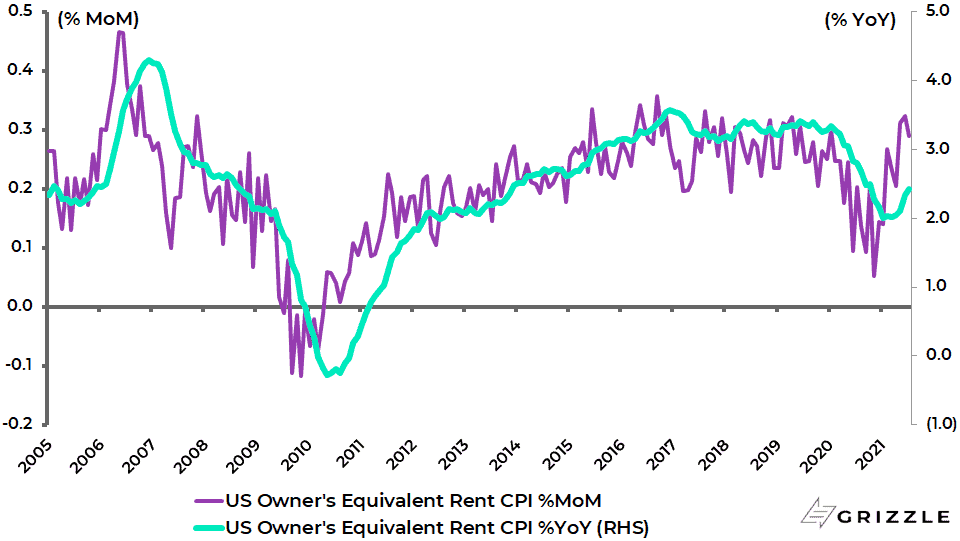
With CPI rents slow to adjust to reality as individual properties are surveyed only once every six months, the recent increase in market rents point to continued gains in the shelter component of CPI in coming months.
On a year-on-year basis, shelter CPI inflation has risen from 1.5% YoY in February to 2.8% YoY in July.
Another way of monitoring inflation shows every indication of continuing strength in coming months.
Thus, assuming only 0.0% MoM growth going forward, US CPI inflation and core CPI inflation will remain at 4.9% YoY and 3.9% YoY respectively in August and 4.1% and 3.4% in December.
While based on an assumption of 0.2% MoM growth going forward, CPI and core CPI will rise by 5.1% and 4.1% YoY in August and 5.1% and 4.4% YoY in December.
US CPI projections assuming 0.0% or 0.2% MoM growth going forward
| Projection assuming 0.0%MoM | Projection assuming 0.2%MoM | |||
| CPI | Core CPI | CPI | Core CPI | |
| %YoY | %YoY | %YoY | %YoY | |
| Jan-21 | 1.4 | 1.4 | 1.4 | 1.4 |
| Feb-21 | 1.7 | 1.3 | 1.7 | 1.3 |
| Mar-21 | 2.6 | 1.6 | 2.6 | 1.6 |
| Apr-21 | 4.2 | 3.0 | 4.2 | 3.0 |
| May-21 | 5.0 | 3.8 | 5.0 | 3.8 |
| Jun-21 | 5.4 | 4.5 | 5.4 | 4.5 |
| Jul-21 | 5.4 | 4.3 | 5.4 | 4.3 |
| Aug-21 | 4.9 | 3.9 | 5.1 | 4.1 |
| Sep-21 | 4.7 | 3.7 | 5.1 | 4.1 |
| Oct-21 | 4.5 | 3.6 | 5.2 | 4.2 |
| Nov-21 | 4.3 | 3.4 | 5.2 | 4.3 |
| Dec-21 | 4.1 | 3.4 | 5.1 | 4.4 |
Source: US Bureau of Labor Statistics
The Bond Market Rally is Hurting Cyclical Stocks
Returning to stock market issues, the recent bond rally has clearly negatively impacted the cyclical trade, with energy stocks also hit by the OPEC agreement last month to increase supply on a controlled basis.
OPEC and its Russia-led oil-producing allies agreed to increase oil production by 400,000 barrels/day each month starting August.
The plan is to phase out the pandemic-era production cuts of 5.8m barrels/day by the end of September 2022, subject to market conditions.
Meanwhile, the other negative for the cyclical trade has been the global surge in the Delta variant.
Still this writer has not given up on the cyclical trade, though clearly the emergence of a Covid variant which is virus resistant would be disastrous.
Big Tech Buoyed by Lower Bond Yields
That said, the recent bond rally has clearly boosted the share prices of those tech stocks which generate cash, as represented by the Big Tech stocks, in a US stock market rally which has of late become perilously narrow.
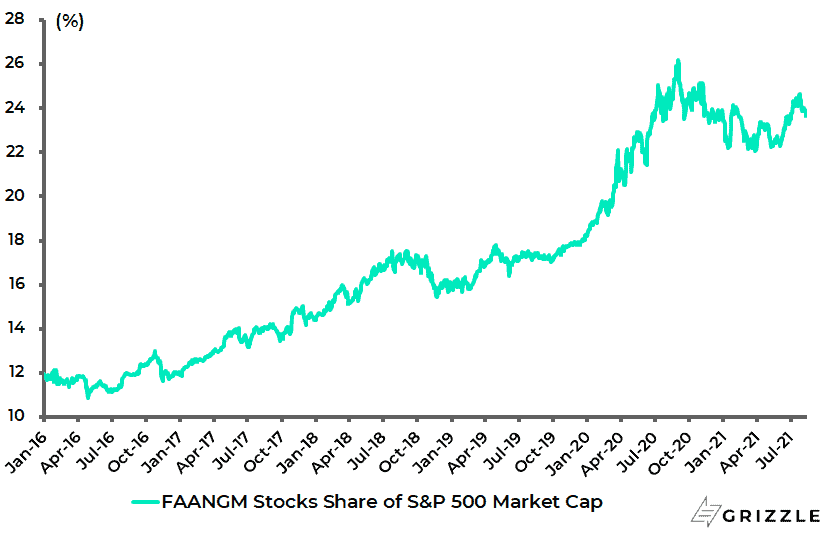
The six Big Tech stocks, namely Facebook, Amazon, Apple, Netflix, Alphabet and Microsoft, accounted for 33% of this quarter’s increase in S&P500 market cap up to the end of last week and 48% since early June.
Still the Big Tech stocks have not yet taken out their peak relative to the S&P500 made last September.
They now account for 23.9% of the S&P500 market cap, up from a recent low of 22.3% on 3 June but remains below the peak of 26.2% reached at the start of September 2020.
US Big Tech stocks’ share of S&P500 market cap
That said the fact that they rallied so hard recently reflects not just the discounting of lower bond yields based on their seemingly assured cash flows, but also the continuing lack, for now at least, of a regulatory attack on Big Tech by the Biden administration.
Here the contrast with China could not be more extreme given the recent aggressive regulatory agenda against the internet sector in China, be it over monopolistic market positioning or control of data.
Still the divergence in stock market performance between US and China internet has now become extreme.
As an aside, it is worth noting that a major reason why the emerging market asset class has become less correlated to commodities in recent years has been the rise in the importance of the Chinese Internet sector in terms of the overall index.
This can be seen in the chart below showing the correlation between the MSCI Emerging Markets Index and the CRB Index.
The rolling five-year index correlation between the MSCI Emerging Markets and the CRB Index has declined from 0.81 at the start of 2017 to 0.36.
Obviously, this trend has begun to reverse of late.
MSCI Emerging Markets and CRB Index rolling 5-year index correlation

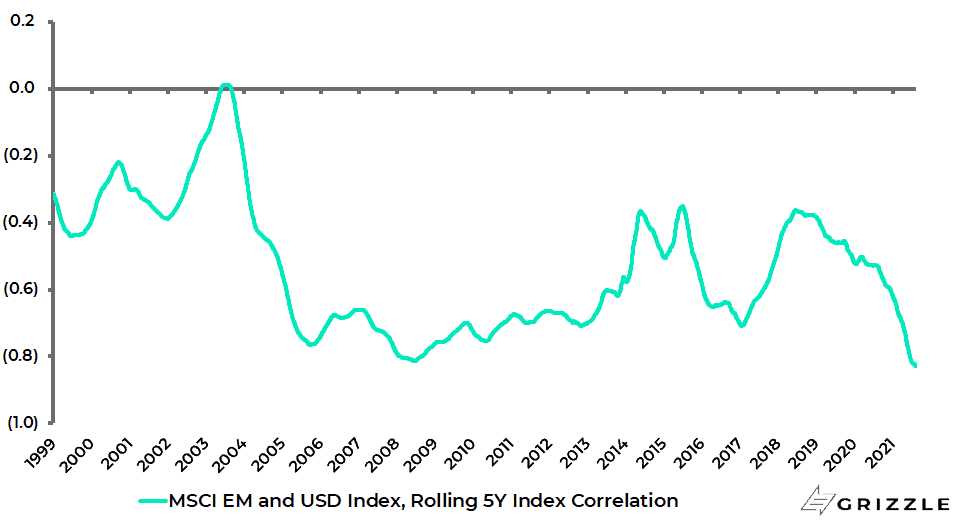
Meanwhile the longstanding negative correlation between the US dollar index and the emerging markets index remains broadly intact.
The rolling five-year index correlation between the MSCI Emerging Markets and the US dollar index is now a negative 0.82, compared with -0.36 in mid-2018.
MSCI Emerging Markets and US Dollar Index rolling 5-year index correlation
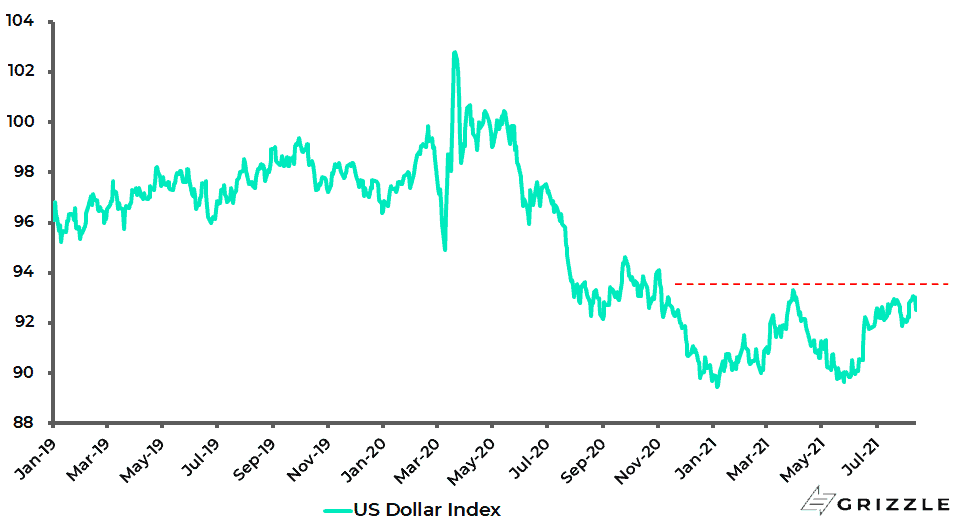
On this point, the US Dollar Index is now near the previous high reached in late March.
This writer’s base case is that the dollar will remain for now in its established trading range.
US Dollar Index
The views expressed in Chris Wood’s column on Grizzle reflect Chris Wood’s personal opinion only, and they have not been reviewed or endorsed by Jefferies. The information in the column has not been reviewed or verified by Jefferies. None of Jefferies, its affiliates or employees, directors or officers shall have any liability whatsoever in connection with the content published on this website.
The opinions provided in this article are those of the author and do not constitute investment advice. Readers should assume that the author and/or employees of Grizzle hold positions in the company or companies mentioned in the article. For more information, please see our Content Disclaimer.