
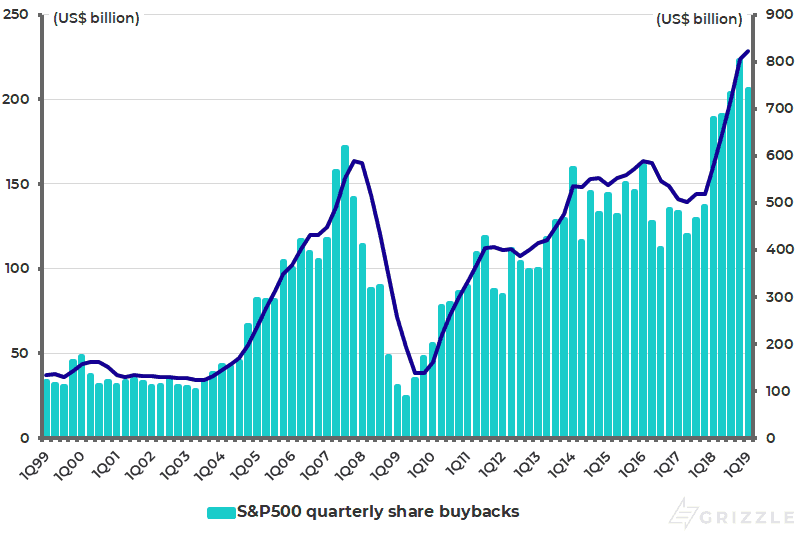
The ludicrous algos have continued to send share prices higher as central bankers have continued to compete to sound more dovish. But I do not really trust the U.S. stock market at this level. Nor should investors with leveraged share buybacks remaining the main driver, aside from anticipated Fed easing. S&P500 actual share buybacks declined by 7.7%QoQ from a record high of US$223 billion in 4Q18 but were still a huge US$206 billion in 1Q19. On an annualized basis, S&P500 share buybacks rose by 43%YoY to a new record high of US$823 billion in the four quarters to 1Q19 (see following chart).
S&P500 Share Buybacks
Doves Flying High Around the World
Meanwhile, the stampede among central bankers to become dovish is not just confined to America. In Europe, Mario Draghi, formerly known as Derivative Draghi, has now formally completed a U-turn on normalization prior to his departure as President of the ECB at the end of October. This means the ECB is likely to send interest rates even more negative and to re-commence balance sheet expansion. The ECB balance sheet currently totals an enormous €4.69 trillion (US$5.27 trillion).
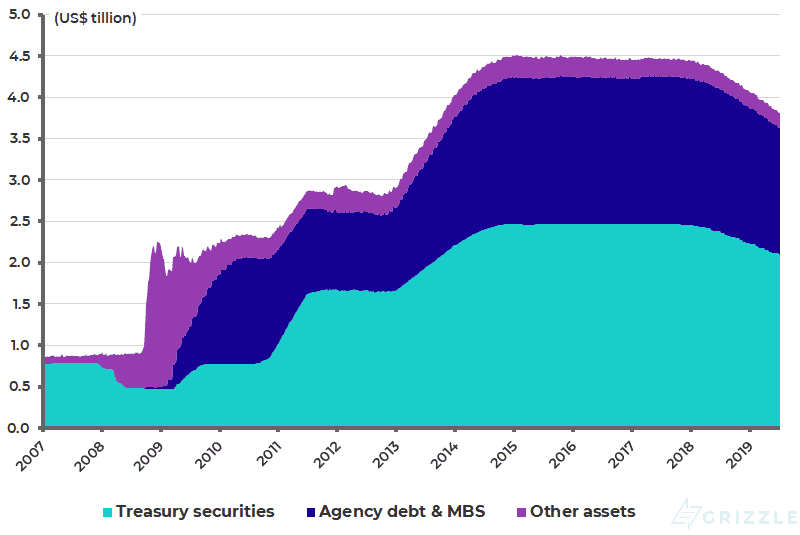
As for the Fed, with both Fed governors and talking heads competing to sound more dovish in terms of the declining rate forecasts, the interesting point now is whether the Fed will end quanto tightening earlier than originally intended (i.e. at the end of September) and renew balance sheet expansion sooner. The Fed balance sheet currently totals US$3.81 trillion (see following chart).
Federal Reserve Balance Sheet
The Threat of Oil
With government bond yields collapsing, and continuing incidents occurring in the Persian Gulf as related to Iran, what would really send markets into convulsions here is a spike in oil. This has a chance of happening, with the Trump administration still pursuing an incendiary policy in terms of trying to impose a ban on Iranian oil exports.
The interesting theoretical point is, if oil spikes above say US$100, how will the U.S. Treasury bond market react? In the medium to long term, such a move in the oil price would be highly deflationary since it would hit consumers’ disposable income. But in the short term oil above US$100 might be seen as inflationary and send Treasury bond prices down.
If that happens in any violent way it could blow up the so-called “risk parity” model and the machines that trade around that model. Remember for both “risk parity” and the machines to be discredited, a period of positive correlation between U.S. stocks and U.S. Treasury bonds on the downside is required (i.e. stocks and bonds go down in price together), as discussed here previously (The Impact of Middle Eastern oil on the U.S. Economy, Nov. 5, 2018).
That was on the verge of happening late last year before the Donald did his U-turn on Iranian oil sanctions last November by announcing waivers that allowed the major buyers of Iranian oil, such as China and India, to keep buying the country’s oil for another six months. There is a risk of this happening again if the escalation in the Middle East continues, regardless of who is behind these escalations.
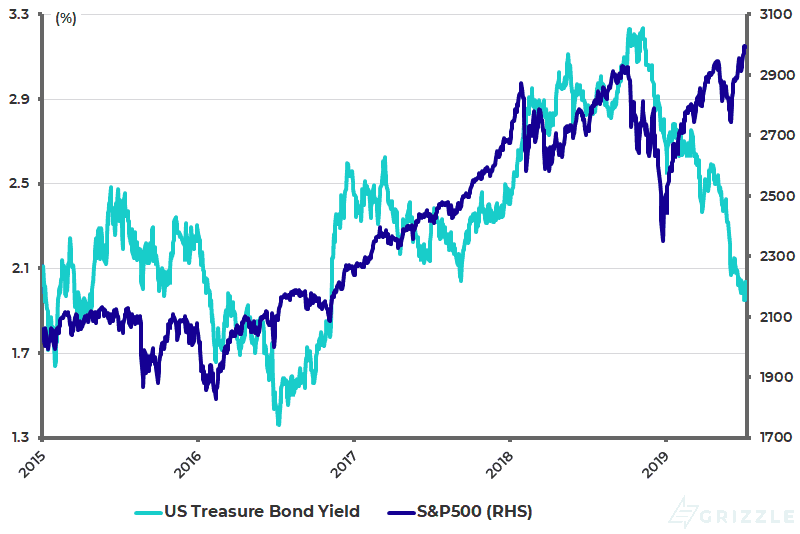
US 10-year Treasury Bond Yield and S&P500
Share Buybacks in America vs. Japan
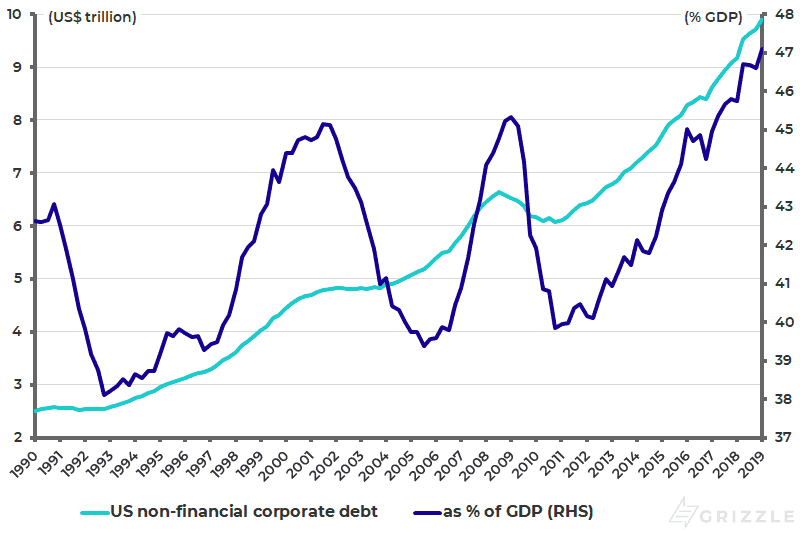
Meanwhile returning to the share buyback theme, it is interesting to contrast the situation in America today with Japan. In America, share buybacks on leverage got another boost of life last year with the Trump administration’s tax reform which created more room on corporate balance sheets to borrow yet more money to buy back more shares. U.S. corporate non-financial debt is now at a record high of 47% of GDP (see following chart).
US Non-financial Corporate Debt as % of GDP
In Japan, however, share buybacks are rising from a low base. Topix-listed companies announced Y2.3 trillion (US$21 billion) worth of share buybacks in 2Q19, according to Bloomberg. The catalyst here remains growing evidence of activism in Japan by both local and foreign players to get Japanese companies to use the excess cash on their balance sheets in a more shareholder-friendly way. More than 50% of Topix non-financial listed companies are net cash. Indeed cash sitting on listed companies’ balance sheets now totals an estimated ¥122 trillion (US$1.13 trillion).
The contrast with Japan, where the share buybacks make fundamental sense, and in America where the motivation is artificial boosting of ROE to increase executives’ compensation, could not be more marked.
The views expressed in Chris Wood’s column on Grizzle reflect Chris Wood’s personal opinion only, and they have not been reviewed or endorsed by Jefferies. The information in the column has not been reviewed or verified by Jefferies. None of Jefferies, its affiliates or employees, directors or officers shall have any liability whatsoever in connection with the content published on this website.
The opinions provided in this article are those of the author and do not constitute investment advice. Readers should assume that the author and/or employees of Grizzle hold positions in the company or companies mentioned in the article. For more information, please see our Content Disclaimer.