What is the Cannabis Scorecard?
The cannabis scorecard is a tool investors can use to judge which Canadian companies are best and worst positioned for the newly legalized recreational market.
A scorecard for the quickly expanding list of US operators will follow.
The scorecard is full of important charts and metrics, providing you with a quick way to judge which company may be worth an investment.
This is the first edition of the cannabis scorecard so please feel free to leave comments or suggestions on how the scorecard can be improved.
Revenue
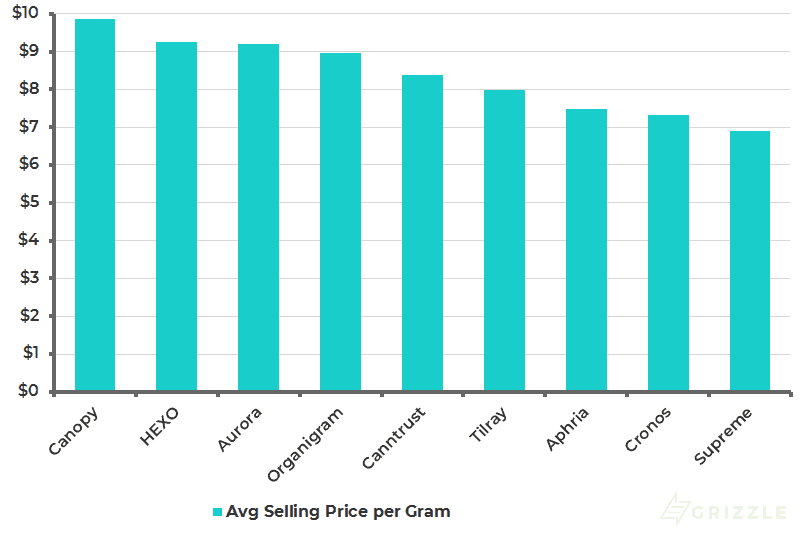
Revenue per gram may seem straightforward, but look a little closer and it can give us some useful information about the pricing strategy of each company.
Does management want to be the premium product in the market, the value brand or something in between?
When supply and demand are balanced a company’s market share often determines what pricing they can get away with. Higher the market share higher the price.
Currently, demand far exceeds legal supply so revenue is mostly based on management’s pricing strategy, making revenue per gram a very useful strategic indicator at this early stage.
For example, Aurora, Canopy Growth, and HEXO look to be playing for the premium segment while Supreme, Aphria, and Cronos are trying to offer more value to drive higher sales.
Selling Price per Gram Equivalent
Growing Costs
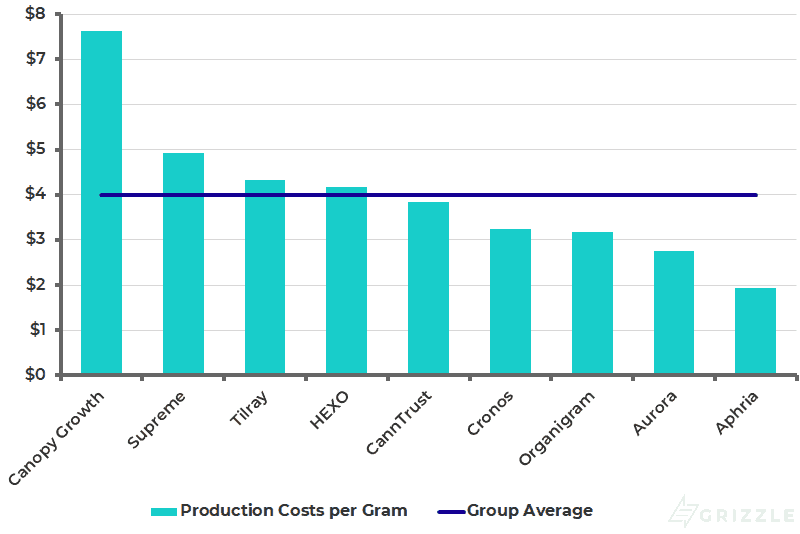
The next piece of the puzzle is growing costs.
Producers are all ramping up capacity to bring down their growing costs to ensure they generate attractive profits even when the government is paying less than producers were used to with their medical clients.
In general, the lower your growing costs the more cash you generate at the end of the day.
Growing Costs per Gram Equivalent
Gross Margin
A wrinkle in our statement that lower costs equal higher profits is the fact that more profitable products like cannabis oils and pills are also more expensive to produce.
Just because a company is high up on the cost scale doesn’t necessarily mean they are less profitable than peers.
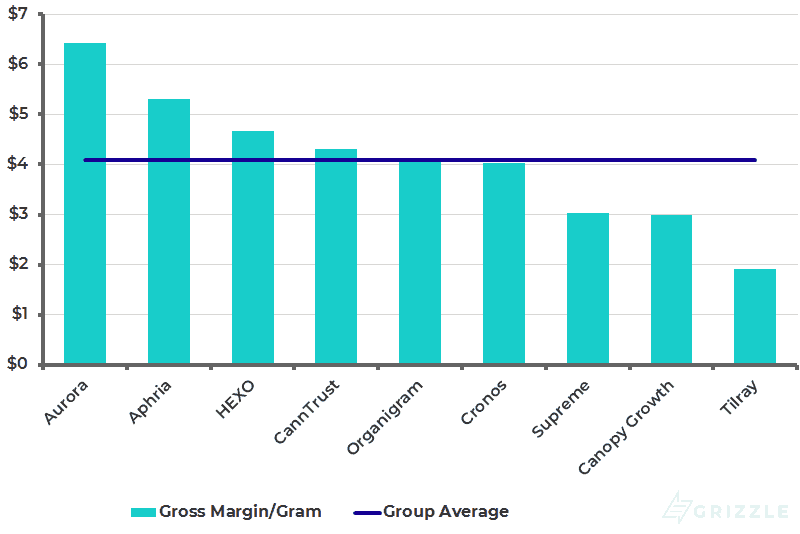
That is why gross margin is the only number we care about.
Gross margin is a true comparison of which grower runs the most profitable greenhouses. It takes into account the price, product mix, and cost of what a grower sells.
Canopy Growth makes $2.40 more per gram than Aphria, but because Canopy has much higher growing costs, Aphria actually generates 80% more profit per gram than Canopy.
This is the power of low production costs. Aphria has the flexibility to undercut competitors to win over more customers while still generating a similar level of profitability.
Gross Margin Per Gram
When Will These Companies Break-Even?
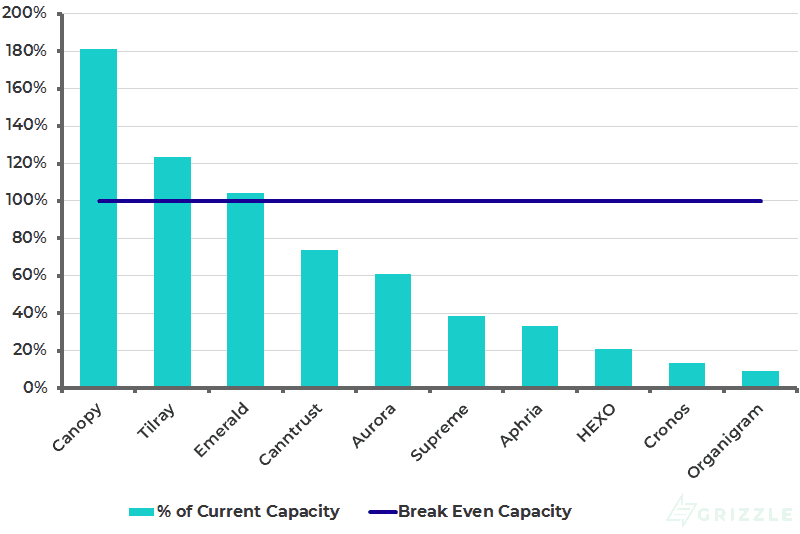
The following charts will help investors assess how close each company is to breaking even, meaning when will revenues equal production and operating costs.
The closer the company’s current production capacity is to their break-even capacity the better.
For example, Aphria has current capacity to harvest 35,000 kg a year but only needs to sell 12,000 kg a year to break-even. This means Aphria should be generating a profit only 3-6 months from now.
Contrast Aphria with Canopy Growth who needs 109,000 kg to break-even, more than the company’s current capacity of 60,000 kg. Canopy has a longer way to go to reach profitability.
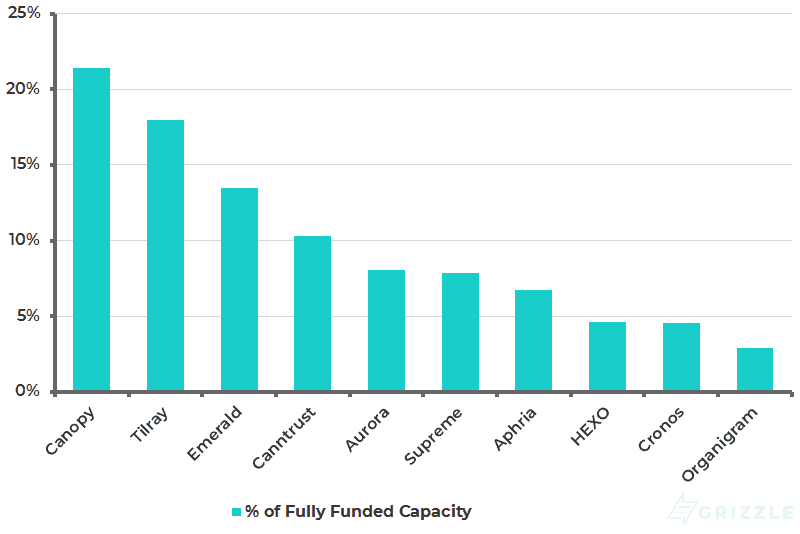
Lower is better in these two charts.
Break-even Capacity as a % of Current Growing Capacity
Break-even Capacity as a % of Fully Funded Growing Capacity
Liquidity
Investors often forget the importance of cash when they are investing in a high growth industry.
Even though licensed producers are seeing rapid revenue growth, they are not yet profitable and still need to spend millions to expand capacity to meet demand. Cash is king.
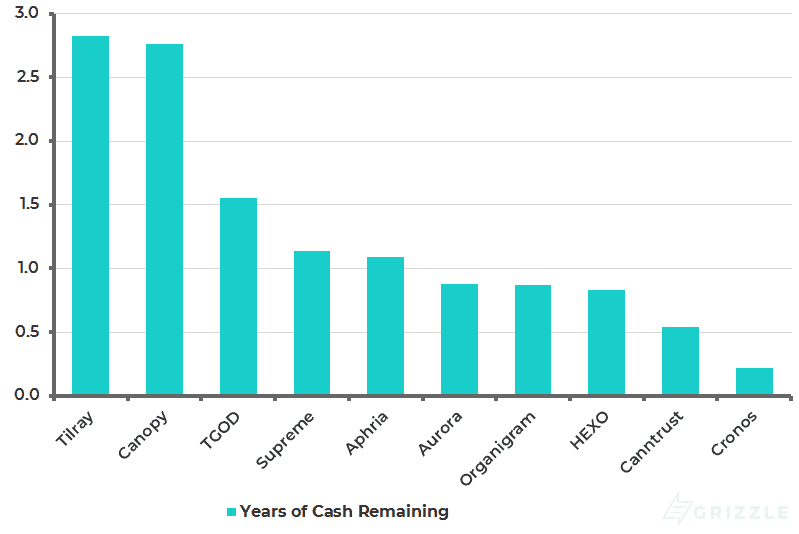
The chart below looks at each company’s cash balance in the latest quarter and their cash burn from operations plus their spending on construction of new greenhouses.
We exclude cash spent on investments because these can be cut back if the company faces a cash crunch.
Keep in mind the cash burn from operations is currently the highest it should ever be as companies ramp up for legalization.
The companies likely have more time until they run out of money than the chart predicts.
Years of Cash Left at Current Burn Rate
Sensitivity Analysis
To help investors put numbers behind the upside and downside for each licensed producer we have provided target stock prices under two different scenarios.
These are two simple starting points and are not inclusive of all possible future scenarios.
If licensed producers are able to exceed our selling price and profitability estimates, there could be upside even in stocks that screen poorly in scenarios 1 and 2.
Scenario 1
Licensed producers reach fully funded capacity and sell their products for $5.00 per gram on average which is the expected wholesale price paid by government distributors. They generate a 30% EBITDA margin on sales. The market is willing to pay a 10x EBITDA multiple, in line with major beer companies like Miller Coors and Budweiser.
| Current Price (CAD) | Implied Value | Upside/Downside | |
| OGI | $5.59 | $11.57 | 107% |
| TGOD | $3.39 | $5.41 | 59% |
| TRST | $8.31 | $13.09 | 58% |
| FIRE | $1.70 | $2.44 | 44% |
| HEXO | $6.20 | $8.14 | 31% |
| APH | $12.66 | $16.51 | 30% |
| EMH | $3.92 | $4.29 | 9% |
| ACB | $8.39 | $5.50 | -34% |
| CRON | $11.32 | $6.78 | -40% |
| WEED | $46.32 | $22.91 | -51% |
| TLRY | $143.62 | $41.12 | -71% |
*Prices as of 11/16/2018
Scenario 2
Licensed producers reach fully funded capacity and sell their products for $8.00 per gram due to the release of higher margin infused drinks, edibles, beauty products, and higher priced exports to other countries. They generate a 30% EBITDA margin on sales. The market is willing to pay a 15x EBITDA multiple, in line with major wine and spirits companies like Diageo and Constellation Brands.
| Current Price (CAD) | Implied Value | Upside/Downside | |
| OGI | $5.59 | $26.43 | 373% |
| TGOD | $3.39 | $11.73 | 246% |
| FIRE | $1.70 | $5.86 | 245% |
| TRST | $8.31 | $31.32 | 277% |
| HEXO | $6.20 | $18.21 | 194% |
| APH | $12.66 | $38.22 | 202% |
| EMH | $3.92 | $9.87 | 152% |
| ACB | $8.39 | $12.83 | 53% |
| CRON | $11.32 | $16.04 | 42% |
| WEED | $46.32 | $40.70 | -12% |
| TLRY | $143.62 | $71.58 | -50% |
*Prices as of 11/16/2018
The opinions provided in this article are those of the author and do not constitute investment advice. Readers should assume that the author and/or employees of Grizzle hold positions in the company or companies mentioned in the article. For more information, please see our Content Disclaimer.