
The US bond market sell-off has continued and with it the increased potential for an inflation scare.
Still, there is plenty of scope for bonds to sell off more since the last time the 5-year 5-year forward inflation expectation rate was running at recent high levels, namely in early December 2018, the ten-and thirty-year bond yields were significantly higher.
The 10-year and 30-year Treasury bond yields were 2.91% and 3.17% in early December 2018, compared with the current 1.62% and 2.38%.
US 5Y 5Y forward inflation expectation rate and Treasury bond yields
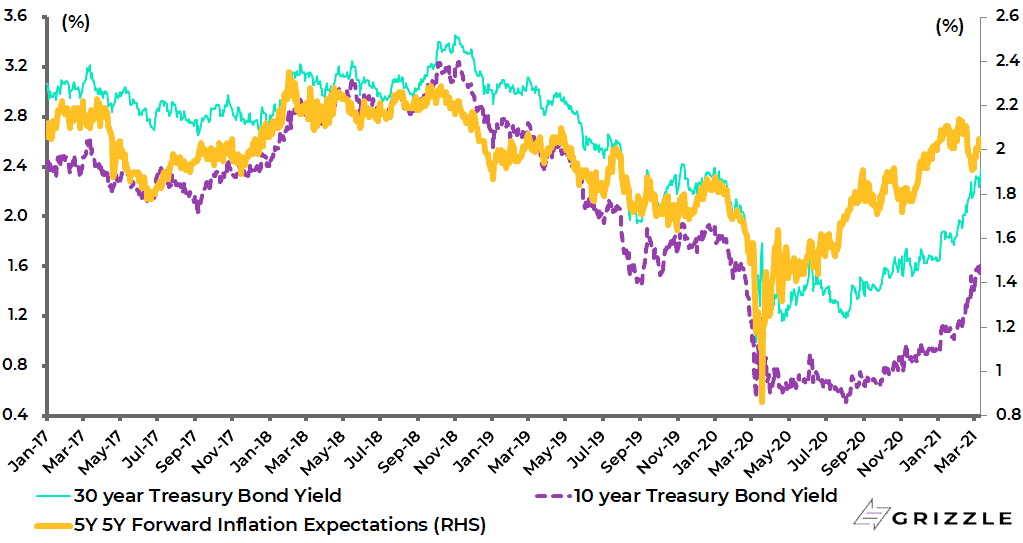
This raises the issue of whether Treasury bond yields are being held down either by Fed buying, or by expectations of yield curve control or by bond bulls taking advantage of the back up in yields to buy.
The answer could be all three.
That there are those willing to be buyers should not surprise since essentially every inflation scare in the US has been a false one since former Fed chairman Paul Volcker imposed crushingly high real rates on the American economy back in the early 1980s.
Certainly, in the more than 35 years of monitoring financial markets, this writer has had a productive time labeling every inflation scare as phony.
The only real risk to this outlook is that there is a surge in new Covid variants against which vaccines prove ineffective.
And if the anticipated inflation surge on the reopening is not met with a committed return to monetary policy orthodoxy then, the odds will have grown dramatically that inflation will start trending higher on a longer-term basis, accompanied by a trend change in velocity.
In such an outcome the Covid triggered lockdowns in the Western world will turn out to have marked a bottoming out in velocity.
This would be appropriate since it is hard to imagine a set of circumstances more likely to trigger a final bottoming out of velocity than the formal lockdown of an economy.
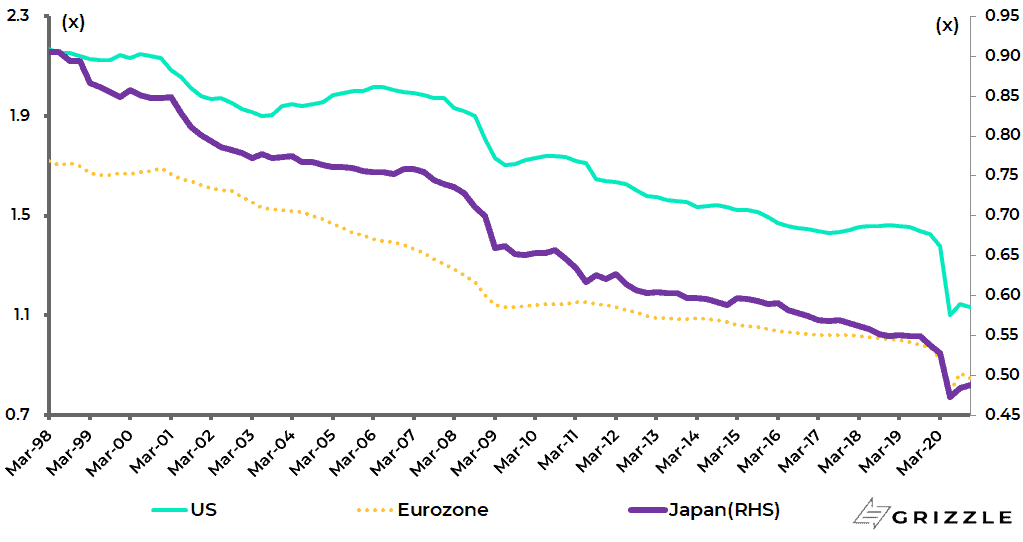
US, Japan Eurozone money velocity (Nominal GDP/M2)
Commodity Prices, Hard and Soft, are Surging
Meanwhile what is clear today is that the prices of commodities hard and soft are surging, save for gold, even though most Western economies remain in varying degrees of lockdown.
This writer is not a commodity analyst.
But it is worth spelling out what has been going on in the commodity space in terms of the price rises, and the resulting surge in input costs, which raises the issue of whether companies will be able to pass on these price increases to end consumers.
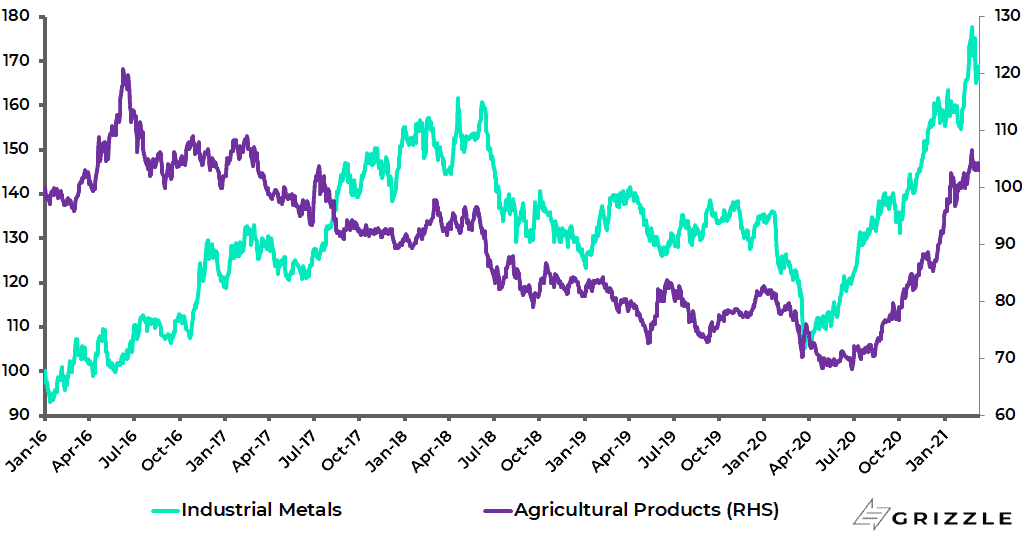
Thus, the Bloomberg Agriculture Price Index and the Bloomberg Industrial Metals Index have risen by 8.1% and 8.3% respectively so far this year and are now up 52% and 60% from their 2020 lows.
Bloomberg Commodity Agriculture and Industrial Metals Total Return Indices
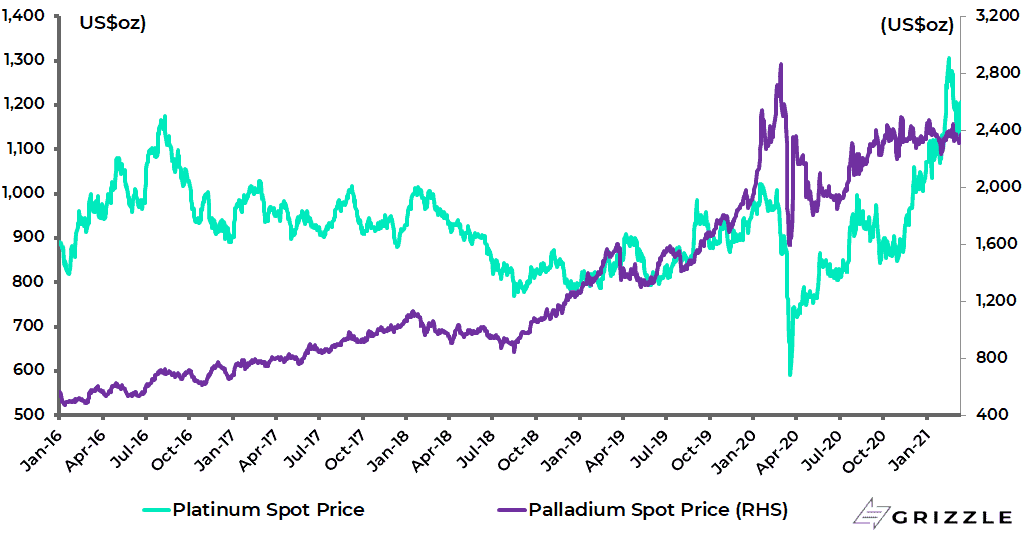
While platinum and palladium prices have risen by 104% and 48% from their March 2020 lows.
Platinum and Palladium Prices
What is to be made of this across-the-board strength in the commodity asset class?
Aside from being a signal of long-term US dollar weakness, there would for now primarily seem to be supply factors at work.
Take oil, for example.
Saudi Arabia’s surprise move in January to curb OPEC supply has been a major positive for the market.
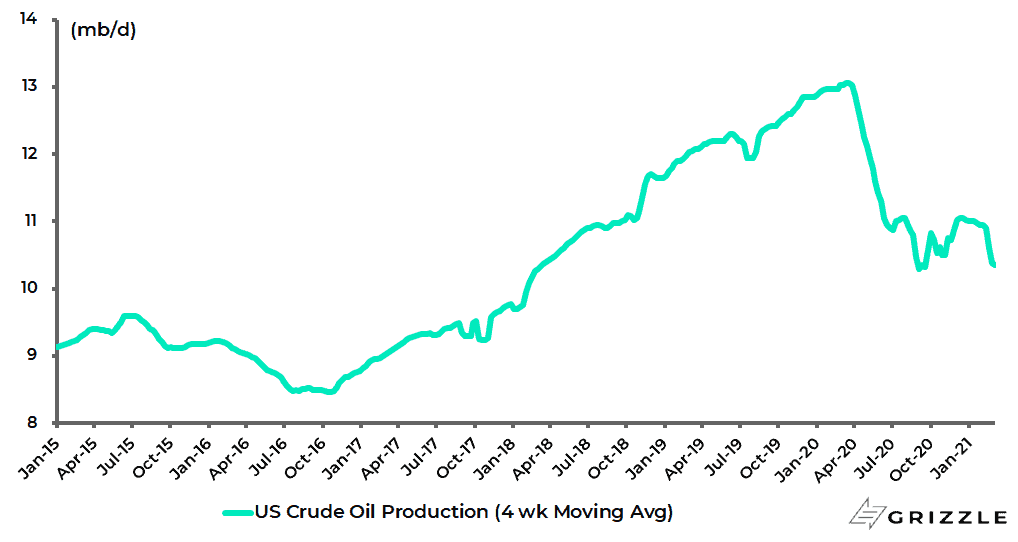
But this also came at a time when US production has been declining more than expected.
US total crude oil production fell by 2.7m barrels/day year-on-year to 10.4m b/d in early March, based on the latest weekly data from the US Energy Information Administration (EIA).
US Crude Oil Production
There is also evidence of a pickup in demand.
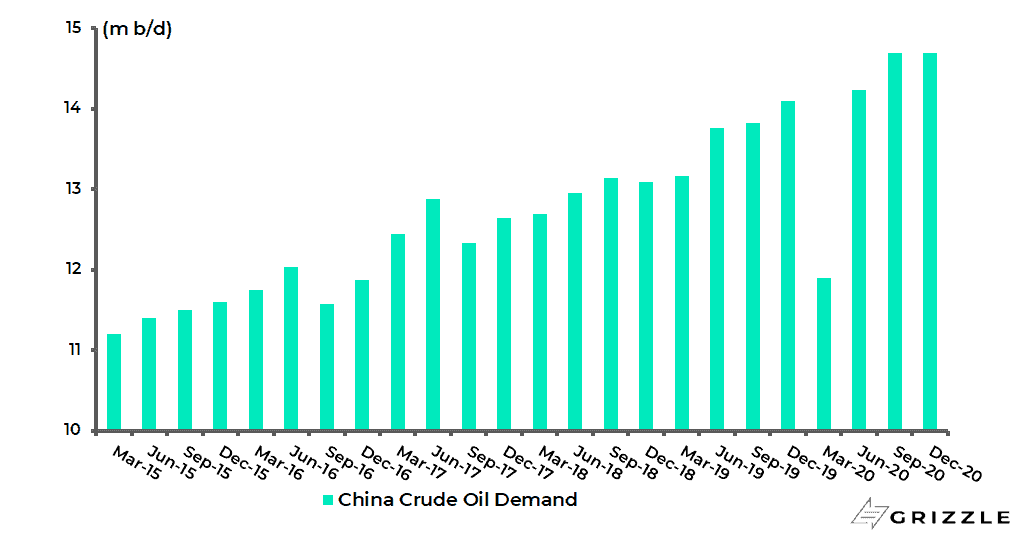
Oil consumption in China has made new highs despite the pandemic, while consumption in India has of late rebounded to near the pre-Covid levels.
China crude oil demand rose from 11.9m barrels/day in 1Q20 to a record 14.7m barrels/day in both 3Q20 and 4Q20, according to the International Energy Agency (IEA).
China Crude Oil Demand
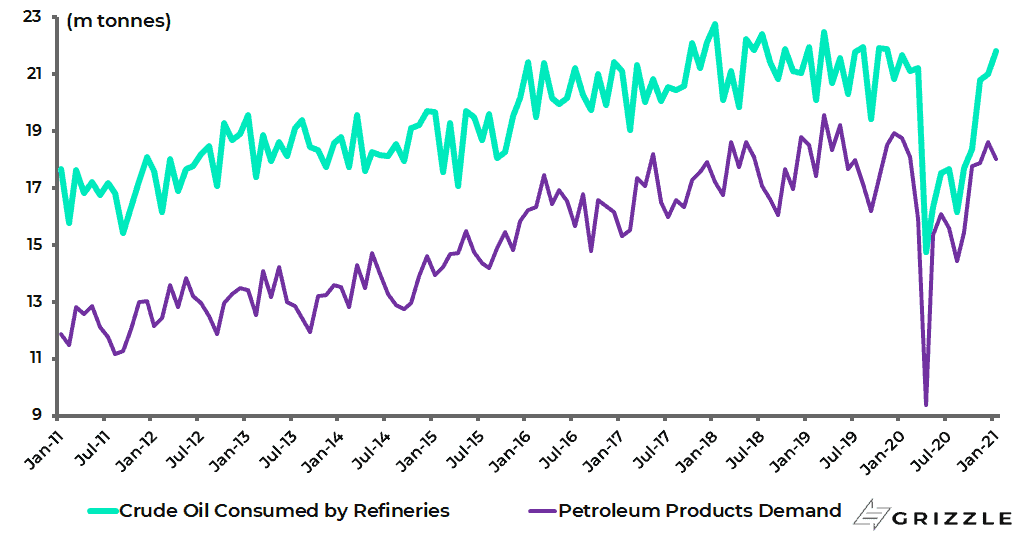
As for India, crude oil consumed by refineries rose by 0.6% YoY to 21.8m tonnes in January, up from a low of 14.7m tonnes in April 2020.
While India’s petroleum products demand rose from a low of 9.4m tonnes in April 2020 to 18.6m tonnes in December, the highest level since January 2020, and was 17.2m tonnes in February 2021.
India Monthly Oil Consumption
Indeed despite all the talk of the end of fossil fuels, oil demand is back running at 94-95m b/d, only 5-6m b/d below the all-time peak of 100m b/d level recorded in 2019.
That gap is almost entirely explained by a decline in jet fuel demand, the continuing consequence both of countries closing their borders and/or imposing quarantines on returning residents.
Copper Fundamentals Rarely Look This Good
Meanwhile, if the oil price can definitely further surprise on the upside, the same also applies to copper.
Copper is the most supply-constrained commodity in the world in terms of a lack of production.
But the added positive going for copper is that the now fashionable activity for generating electricity from “renewable” sources is also very copper intensive.
This is because copper is a highly efficient conductor of electricity and helps reduce carbon emissions.
The above is why it is entirely feasible that copper replicates, if not improves upon, the six-fold increase in prices it managed in the last copper bull market when it rose from US 61 cents per pound in 2001 to a peak of US$4.65 in 2011.
CMX Copper Price
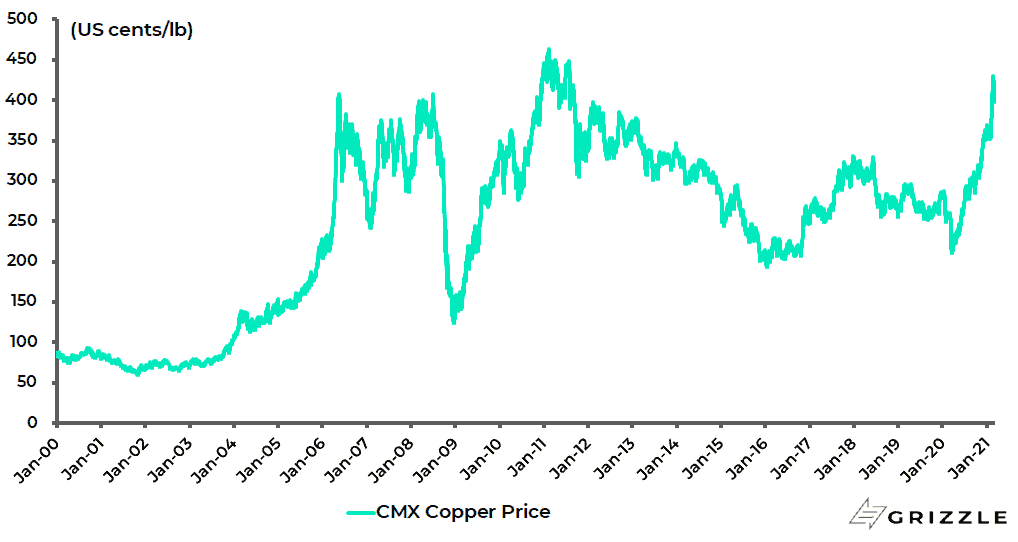
This cycle the low point was US$2 which means a price target of US$12 is not unrealistic though, as with oil and other commodities, the outcome will be higher if inflation really returns and the US dollar is debased further by the Federal Reserve.
As for the supply-demand picture on copper, there is by all accounts a structural deficit.
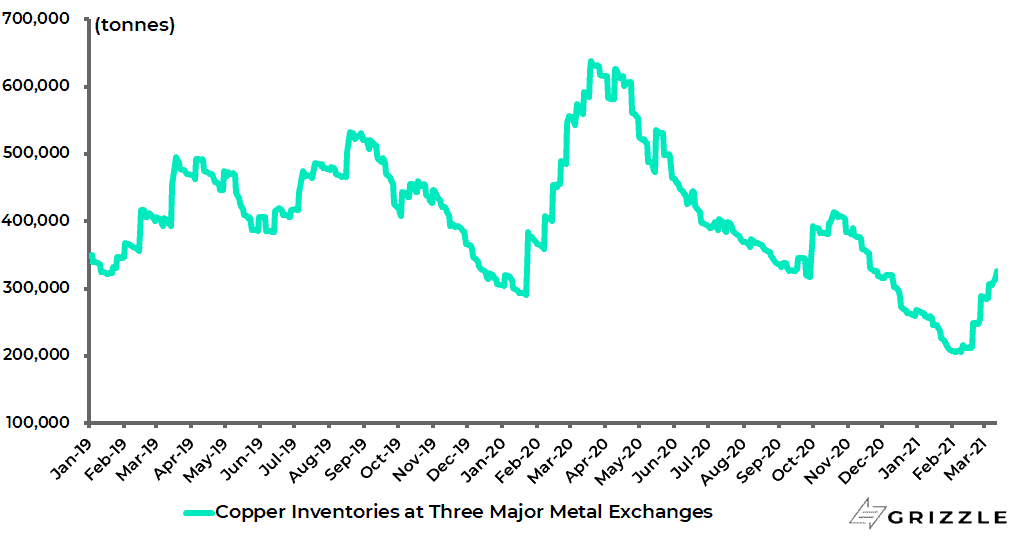
There has also been a collapse in copper inventories over the past year.
Total copper inventories at the three major metal exchanges (LME, COMEX and Shanghai Futures Exchange) have declined by 49% from 638,375 tonnes in March 2020 to 325,814 tonnes on Friday, though up from a low of 205,712 tonnes in early February.
Copper Inventories at Three Major Metal Exchanges
Meanwhile, there is a lack of new bigger copper projects coming on stream with, for example, first production from the much-discussed underground Oyu Tolgoi expansion project in Mongolia now potentially delayed until 2023.
As for demand, Chinese copper consumption grew by an impressive 17% YoY in 2020 even as the rest of the world registered a 6.5% decline.
Still, China demand meant that total aggregate consumption grew 6% last year, according to the World Bureau of Metal Statistics.
Soft Commodity Prices Also Signal Higher Inflation
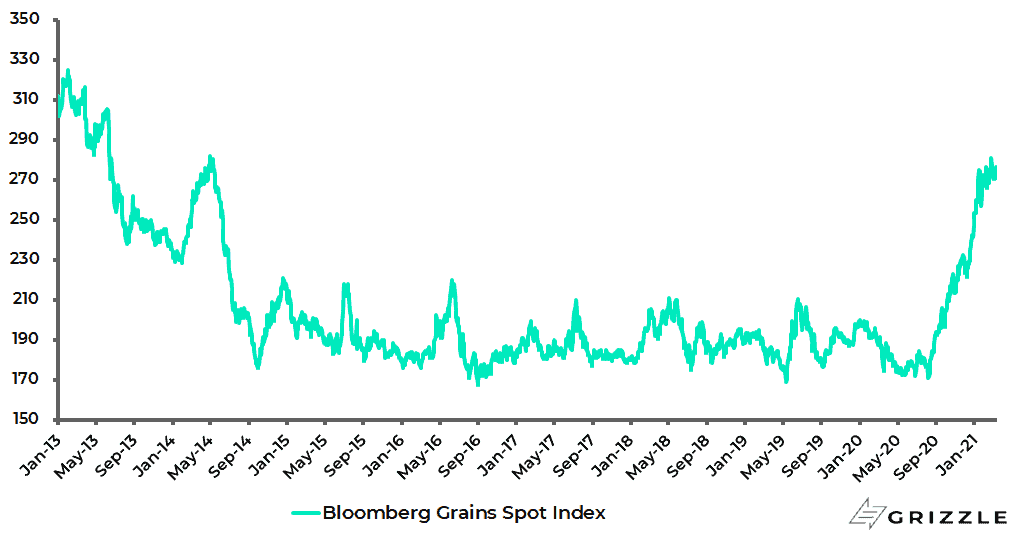
Then there are the agricultural “soft” commodities where the price of grains and soybeans have of late been surging.
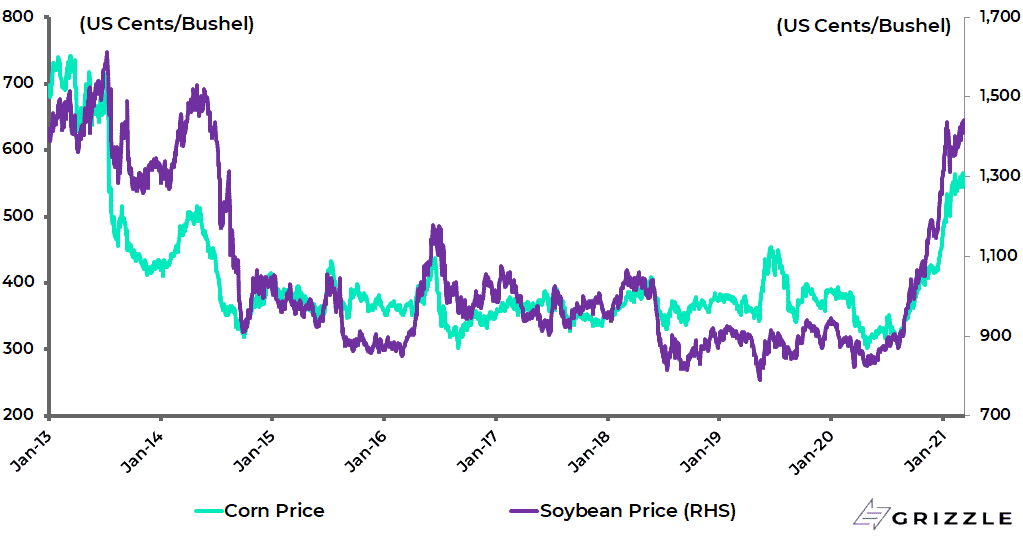
The Bloomberg Grains Spot Index has risen by 58% since early August 2020, while corn and soybean prices are up 78% and 63% over the same period.
Bloomberg Grains Spot Price Index
Corn and Soybeans Futures Prices in Chicago Board of Trade
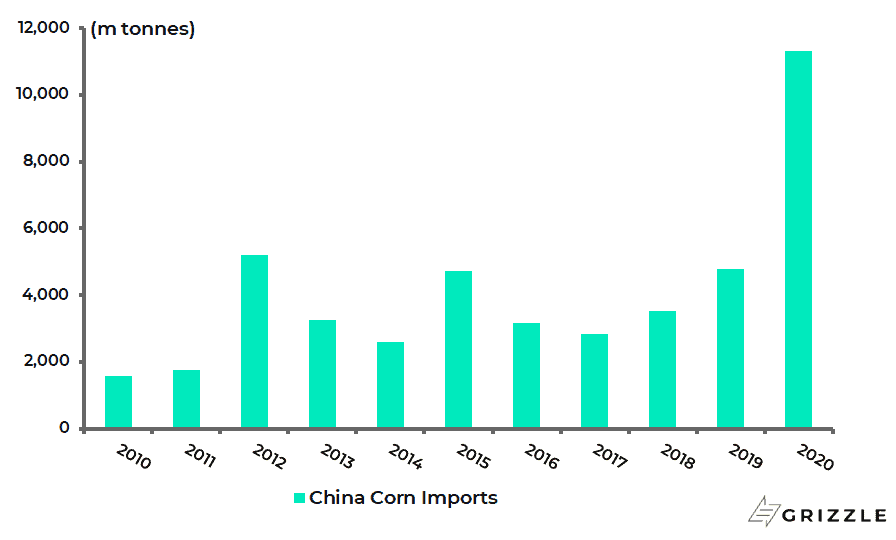
Global consumption of grains has risen from 2% YoY growth a year to 3% YoY since the start of this century, with China and other emerging market demand the main factor as consumption of proteins has grown with rising GDP per capita.
Chinese imports of corn rose by 136% YoY to a record 11.3m tonnes in 2020, according to official customs data.
China Corn Imports
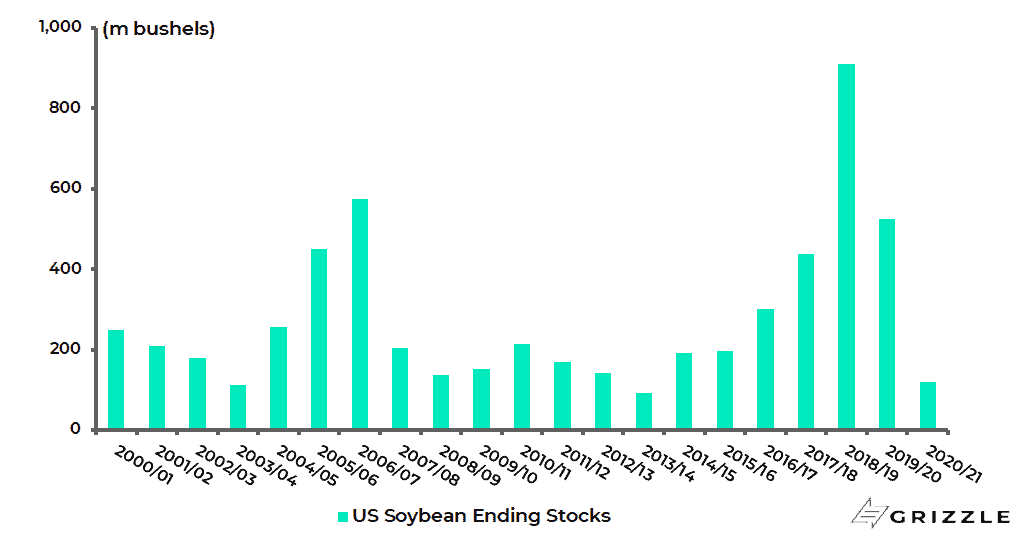
Another near-term pressure point is critically low inventory levels of soybeans.
US soybean ending stocks are now estimated by the US Department of Agriculture to be 120m bushels for the current market year ending 31 August, down from 909m bushel in 2018/19 and the lowest level in seven years.
US Soybeans Ending Stocks (market year ending 31 August)
As a result, farmers, particularly those raising cattle, hogs and poultry, are now getting squeezed by the highest corn and soybean prices in seven years.
Structurally Higher Inflation is a Risk for the G7 Countries
From an Asian and emerging market standpoint the recent surge in soft commodity prices undoubtedly represents a significant inflation risk given the larger representation of food in developing countries’ inflation baskets.
Still, if rising food prices are more of an emerging market issue, the real secular inflation risk remains in the G7 world given the far more aggressive fiscal and monetary policies employed and indeed given the growing convergence of these policies.
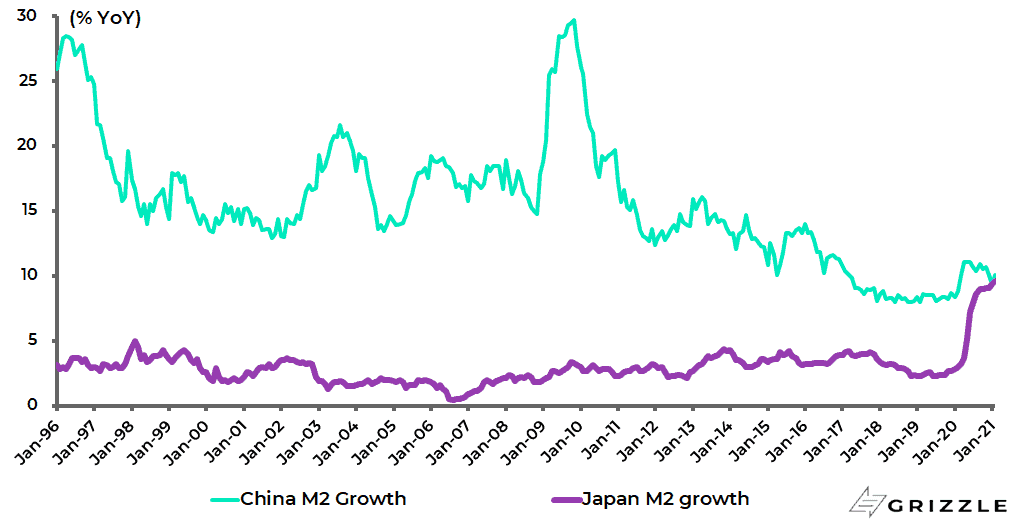
In that respect, it is an interesting factoid that the M2 growth rates in Japan and China converged in January, having been far apart for most of the past three decades.
Japan M2 growth rose from 9.1% YoY in December to 9.4% YoY in January and 9.6% YoY in February, the highest level since November 1990, while China M2 growth declined from 10.1% YoY in December to 9.4% YoY in January and was 10.1% YoY in February.
China and Japan M2 growth
The views expressed in Chris Wood’s column on Grizzle reflect Chris Wood’s personal opinion only, and they have not been reviewed or endorsed by Jefferies. The information in the column has not been reviewed or verified by Jefferies. None of Jefferies, its affiliates or employees, directors or officers shall have any liability whatsoever in connection with the content published on this website.
The opinions provided in this article are those of the author and do not constitute investment advice. Readers should assume that the author and/or employees of Grizzle hold positions in the company or companies mentioned in the article. For more information, please see our Content Disclaimer.