
The US CPI report remains by far the most important monthly data point globally, as financial markets continue to be reminded.
The latest data means that the peaking-out-of-inflation narrative, which drove markets higher over the summer, remains, for now at least, in full-scale retreat.
The September data again exceeded consensus expectations both at the headline and the core level.
US headline CPI rose by 0.4% MoM compared with consensus estimates of a 0.2% MoM decline, while core CPI increased by 0.6% MoM compared with consensus estimates of 0.4% MoM.
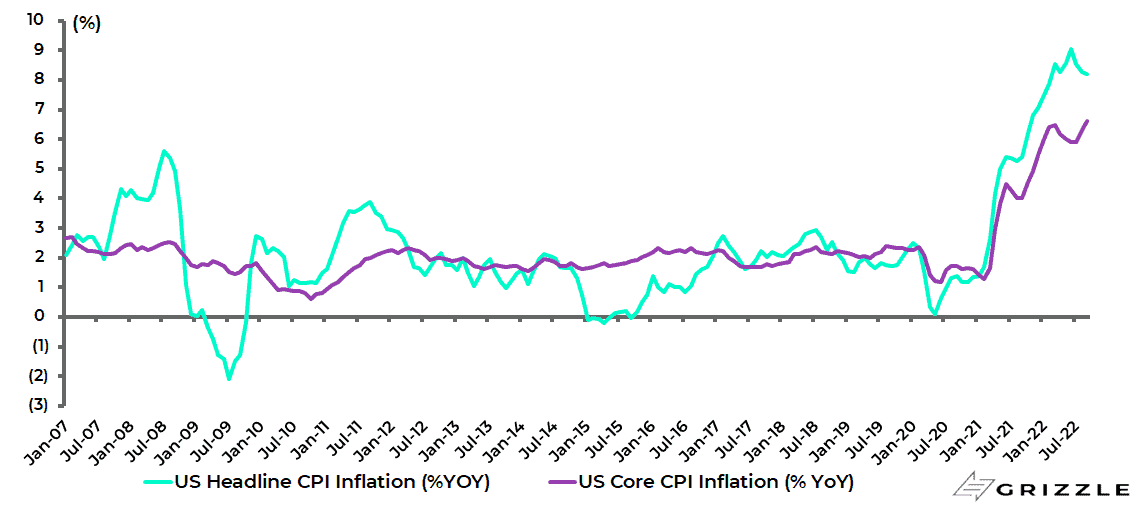
As a result, US headline CPI inflation slowed only from 8.3% YoY in August to 8.2% YoY in September, above consensus expectations of 8.1% YoY, while core CPI inflation rose from 6.3% YoY in August to 6.6% YoY in September.
US CPI and core CPI inflation
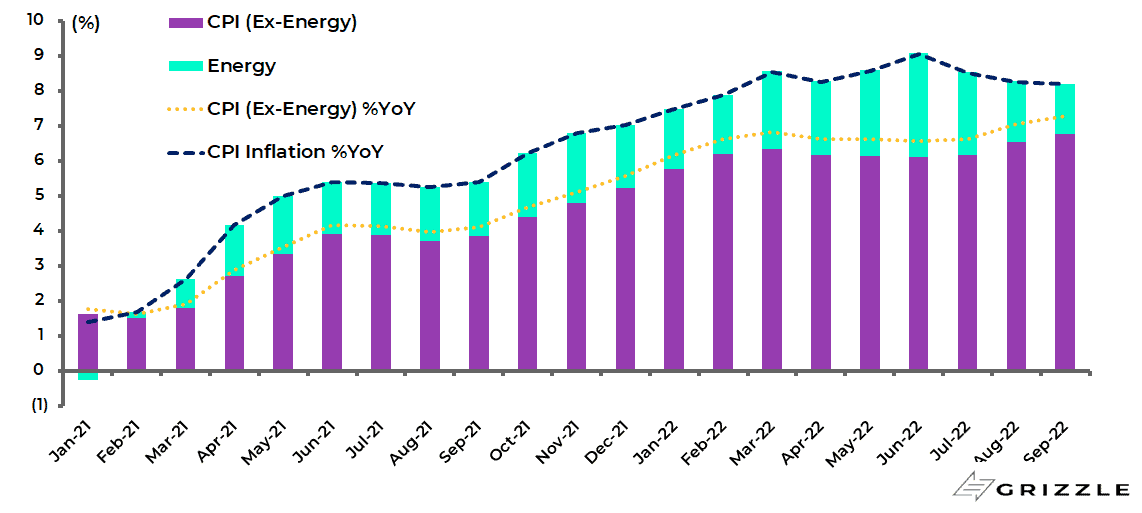
As in August, the decline in headline CPI inflation has been solely driven by the decline in energy prices.
Energy CPI inflation slowed from 23.8% YoY in August to 19.8% YoY in September, after peaking at 41.6% YoY in June, and is down 2.1% MoM.
As a result, energy prices contributed an estimated 1.4ppts to headline CPI inflation in September, down from 1.7ppts in August.
More importantly CPI, excluding energy, actually rose to 7.3% YoY in September, up from 7.1% YoY in August and a flat 6.6% YoY in the period between April-July.
Continuing sticky inflation can, therefore, no longer be blamed on Vladimir Putin.
Contribution to US CPI inflation
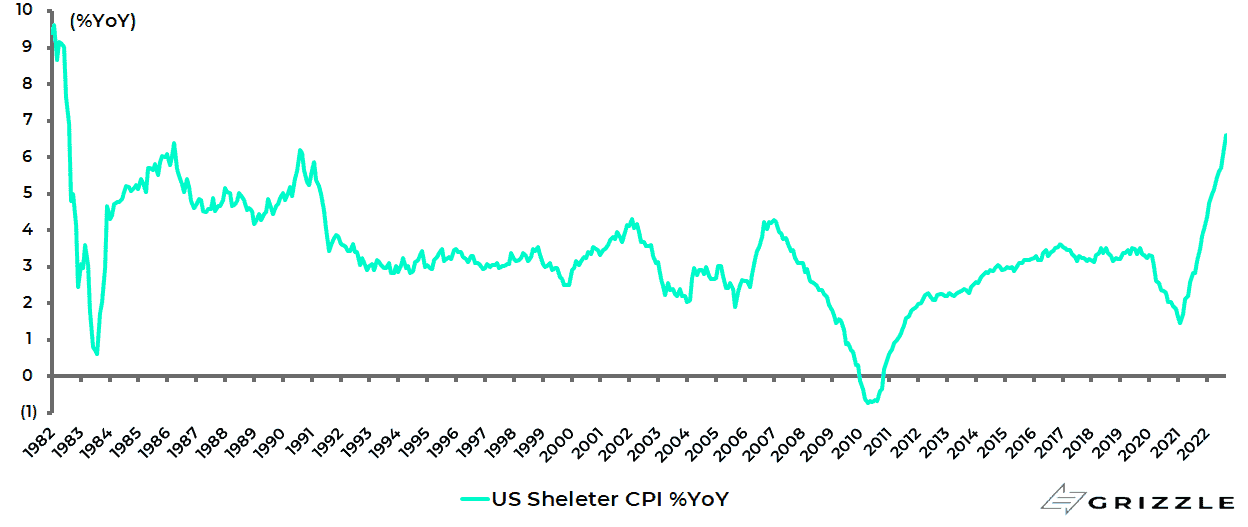
Drilling down into the data more shelter CPI inflation, a proxy for rents, rose from 6.2% YoY in August to 6.6% YoY in September, the highest level since August 1982.
US shelter CPI inflation
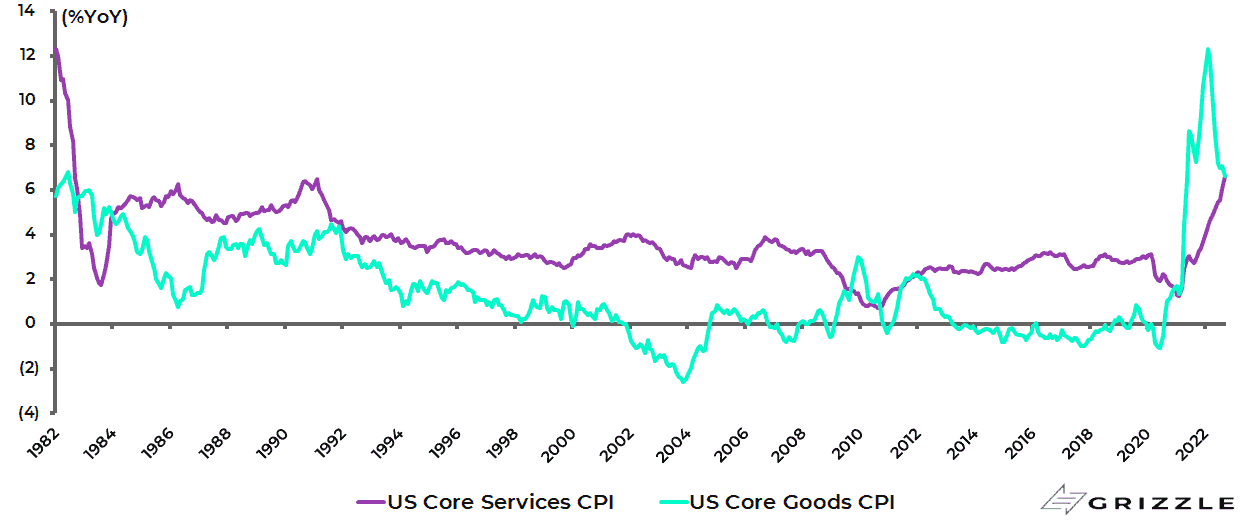
While there is more and more evidence of spreading service sector inflation even if goods inflation may well have peaked.
Core goods CPI inflation slowed from 7.1% YoY in August to 6.6% YoY in September and is down from a peak of 12.3% YoY in February, while core services CPI inflation rose from 6.1% YoY in August to 6.7% YoY, the highest level since August 1982.
US core goods and core services CPI inflation
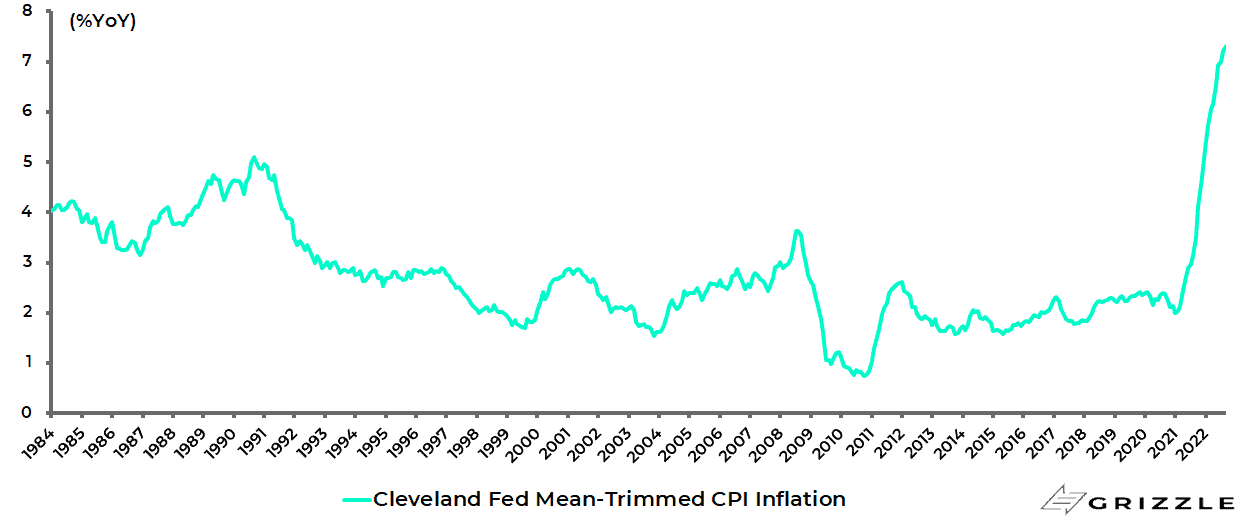
The Cleveland Fed trimmed-mean CPI remains a good measure of spreading inflationary pressures.
This excludes the CPI inflation components each month which have shown the most extreme moves in either an upward or downward direction.
It rose from 7.22% YoY in August to 7.31% YoY in September, the highest level since the data series began in December 1983.
Cleveland Fed trimmed-mean CPI inflation
Meanwhile, 17 of the 36 main CPI categories saw an acceleration in the year-on-year inflation rate while 19 categories decelerated.
Breaking Down Inflation – Not Just About Energy
It makes sense to go into some detail on the breakdown of the inflation numbers because it is important to stress both that the inflation issue is not just about energy, despite the extreme politicisation of that issue, and that there is more and more evidence of inflation becoming entrenched in the services sector.
Still the base effect will become more positive in the October CPI data since the CPI month-on-month change rose from 0.4% in September 2021 to 0.9% in October 2021.
Still it is also worth noting that even if inflation rises by 0% MoM each month for the rest of this year, which is clearly unlikely in the extreme, US headline CPI inflation will still be 5.9% YoY in December and core inflation 4.9% YoY, which in both cases will still be well above the Fed’s 2% target.
US CPI inflation assuming 0.0% MoM going forward
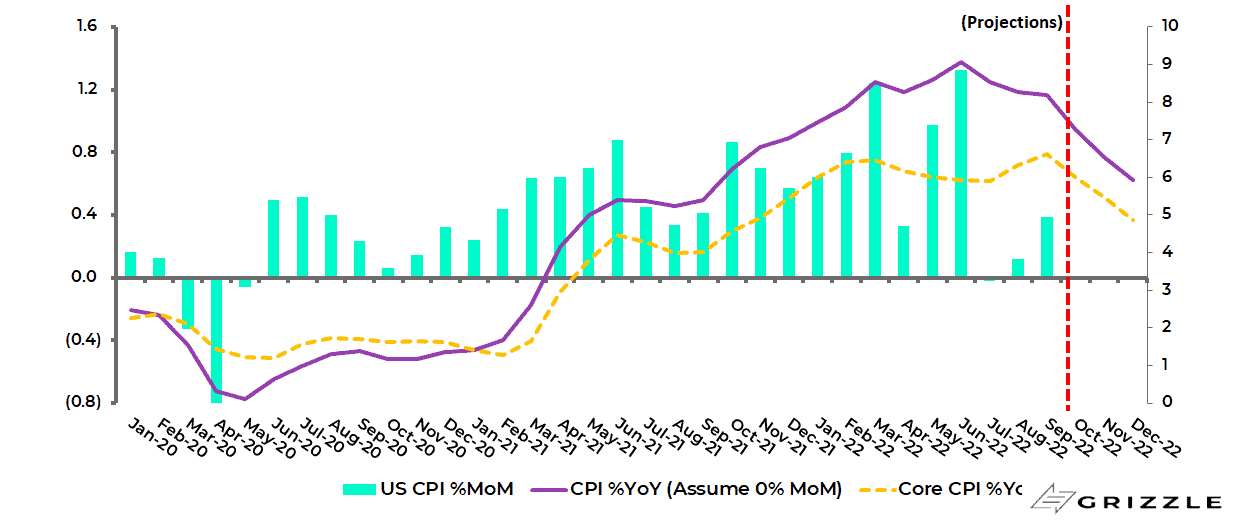
But if, more likely, headline and core rise for the rest of this year by the average of 0.16% MoM and 0.49% MoM seen respectively in the past three months they will be at 6.5% YoY and 6.4% YoY in December.
Luckily for the Fed, Consumer Inflation Expectations are Staying Anchored
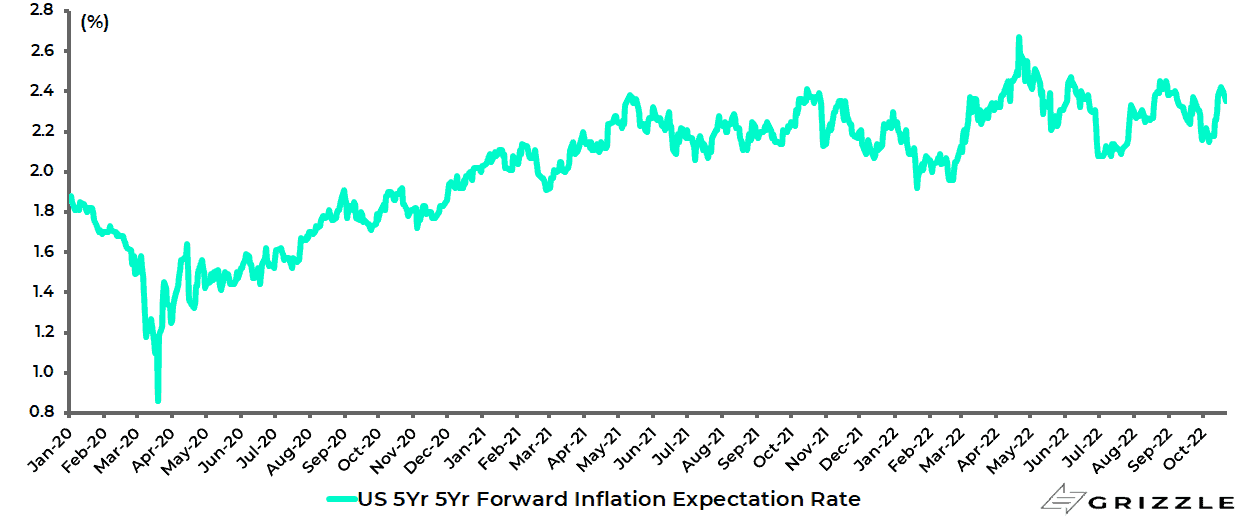
In view of the above data, there has been a renewed pickup in Fed tightening expectations, though the Fed will be relieved that longer term inflation expectations have not surged with the five-year five-year forward inflation expectation rate remaining below the key 2.5% level.
Indeed it has declined from 2.42% on 17 October to 2.35%, though up from 2.15% on 6 October.
US five-year five-year forward inflation expectation rate
The money markets now expect another 175bp Fed rate hike to 4.75-5.0% by March 2023.
So the situation remains the inverse of Goldilocks with the recession risks growing every time the Fed tightens.
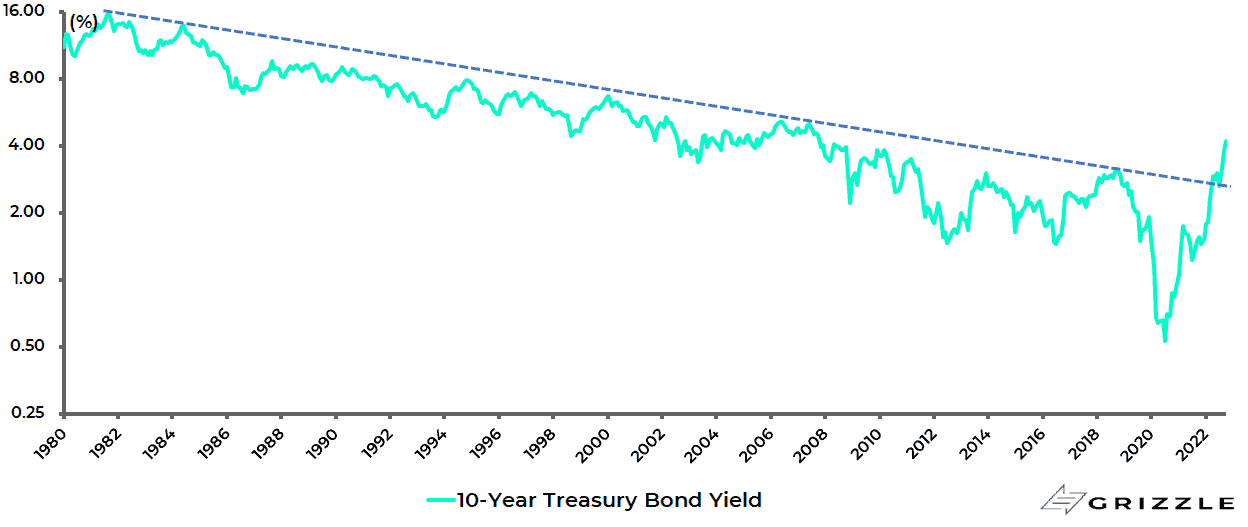
Meanwhile, the real bearish message from the entrenched inflationary pressures is for the fixed income market where the US ten-year Treasury bond yield has now clearly broken above the long-term trend line.
The 10-year Treasury bond yield has risen from a recent low of 2.51% on 2 August to an intraday high of 4.34% on 21 October, well above the long-term trend line at around 2.8%.
US 10-year Treasury bond yield (long scale, monthly)
It is also the case that there remains, for now at least, scant evidence of the sort of financial accident that might renew hopes of a Fed U-turn; though any such U-turn would in itself be government bond bearish given the implications it would have in terms of a fudging or abandonment of the 2% inflation target.
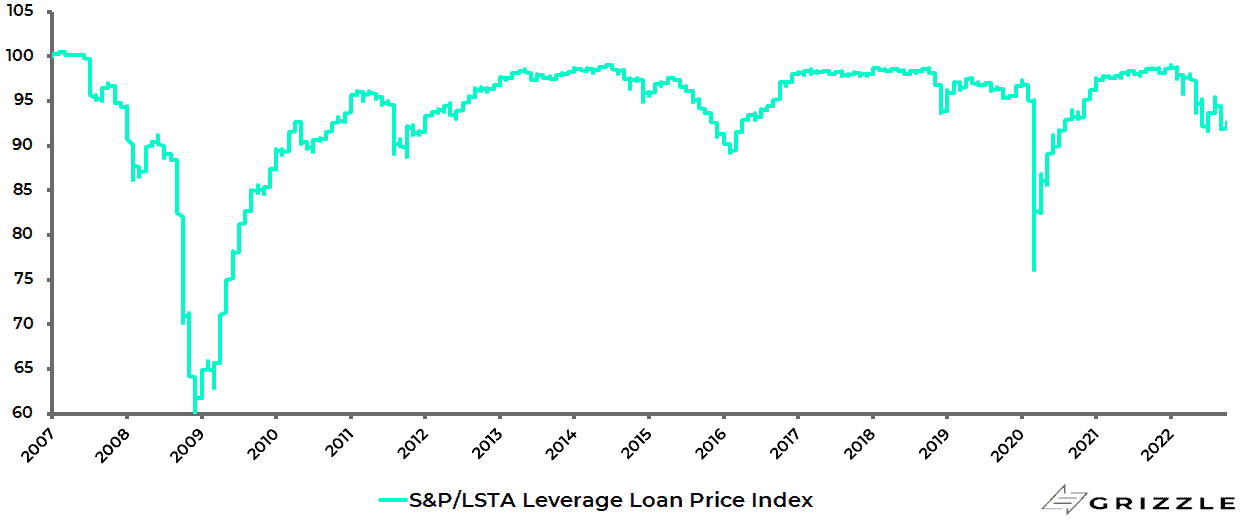
Credit spreads remain remarkably well behaved for now given the scale of rate hikes already implemented while the leveraged loan price index remains only 7% below its recent high of 99.09 reached in January.
US S&P/LSTA Leveraged Loan Price Index
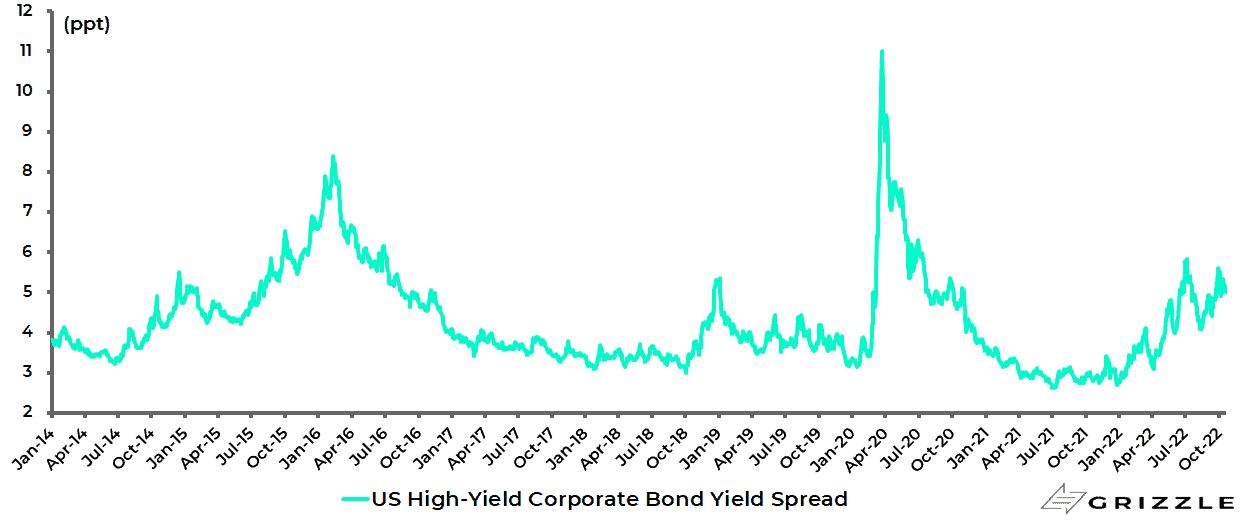
The US high-yield corporate bond yield spread has actually declined from a recent high of 5.83% in early July to 5.07%.
US high-yield corporate bond yield spread
Still the longer monetary tightening proceeds the more inevitable is the likelihood that there will be a growing list of casualties.
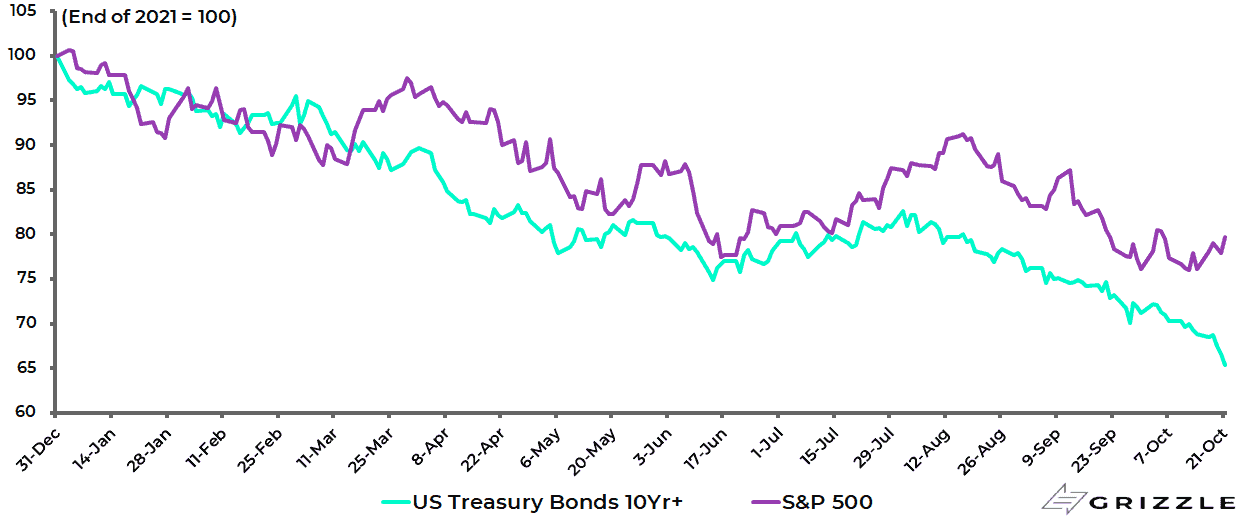
This is particularly the case in financial markets when there is positive correlation on the downside in both equities and government bonds, as has been the case so far this year.
The S&P500 is now down 20.3% year to date on a total-return basis while long-term (10-year+) US Treasuries are down 34.6%.
S&P500 and US 10Y+ Treasury bonds 2022 year-to-date total-return performance
In this respect, if risk parity as a strategy has already seemingly been consigned to the history books, as previously discussed here (see Will The Fed Squeeze The Consumer Until They Break?, 20 June 2022), such will also be the fate of the classic 60/40 balanced portfolio in a world of structurally higher inflation since equities become the only practical option, in terms of ownership of financial assets, for those who do not have to own government bonds for regulatory reasons.
The views expressed in Chris Wood’s column on Grizzle reflect Chris Wood’s personal opinion only, and they have not been reviewed or endorsed by Jefferies. The information in the column has not been reviewed or verified by Jefferies. None of Jefferies, its affiliates or employees, directors or officers shall have any liability whatsoever in connection with the content published on this website.
The opinions provided in this article are those of the author and do not constitute investment advice. Readers should assume that the author and/or employees of Grizzle hold positions in the company or companies mentioned in the article. For more information, please see our Content Disclaimer.