
What is the Marijuana Scorecard?
The marijuana scorecard is a tool investors can use to judge which U.S. marijuana companies are best and worst positioned for the rapidly legalizing American market.
The scorecard is the most comprehensive free marijuana investment resource available, full of important charts and metrics on valuation, liquidity, voting structure, assets and much more.
The scorecard focuses exclusively on vertically integrated U.S. operators. We exclude biotech research driven stocks and smaller growers with market caps below C$200 million and limited liquidity.
This is the first edition of the U.S. marijuana scorecard so please feel free to leave comments or suggestions on how the scorecard can be improved.
Do You Have a Say in the Direction of the Company?
This is one of the most important but often overlooked factors investors should consider when deciding on which company to invest in.
Due to legal restrictions in the U.S. and listing restrictions in Canada, many U.S. operators have created an alternate share class that holds almost all of the corporate voting power.
Share votes are important because they are typically the only way common shareholders can influence the direction of the company.
Shareholders can vote out directors and officers who aren’t doing their job and can influence the direction of the company in many other ways both large and small.
Concerningly for common shareholders in U.S. operators, the special voting shares are not freely traded and so the owners of these shares, almost always insiders, have free reign over how the company is managed.
They can pay themselves big bonuses, go on buying sprees while diluting common shareholders or invest in new businesses that are not a good fit for the company and common shareholders can do nothing about it.
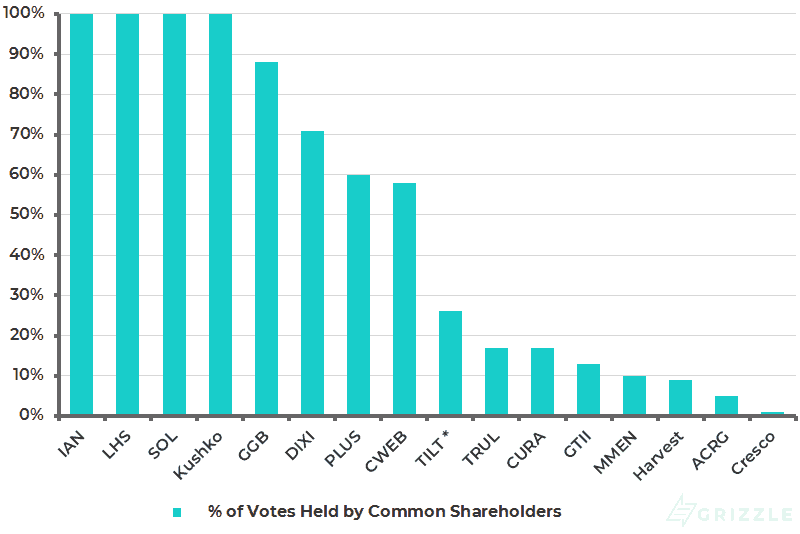
When you are choosing a U.S. marijuana stocks look for one where the majority of votes are in the hands of common shareholders.
% Voting Power of Common Share Class
Footprint
Another important factor to consider is the U.S. operators’ state footprint.
Company management argues that with limited licenses granted in all medically legal states, there are excess profits to be generated before cannabis is legalized countrywide.
They also believe that being an early entrant into a state lets you establish brand recognition, translating into a higher market share as the number of users and sales revenue expands with legalization.
If you believe these two arguments then the more states and the more retail locations the better.
The market is rewarding the larger operators with higher valuations and more funding currently, but with new entrants popping up targeting the technology and logistics sides of the business as well, the footprint may not be the only determinant of success.
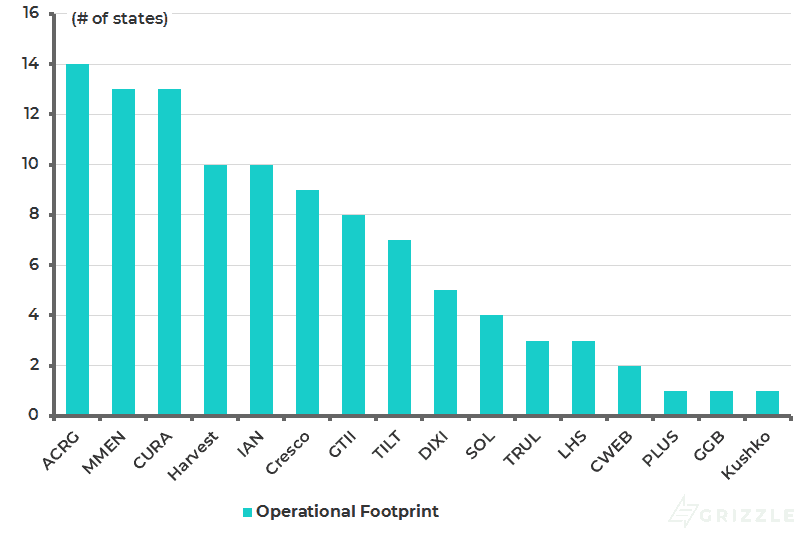
We only count a state if the company has operating assets there. Selling your product or services to a dispensary in a state where you don’t have assets doesn’t count.
Operational Footprint (# of States)
Liquidity
Investors often forget the importance of cash when they are investing in a high growth industry.
Even though licensed producers are seeing rapid revenue growth, they are not yet profitable and still need to spend millions to expand capacity to meet demand. Cash is king.
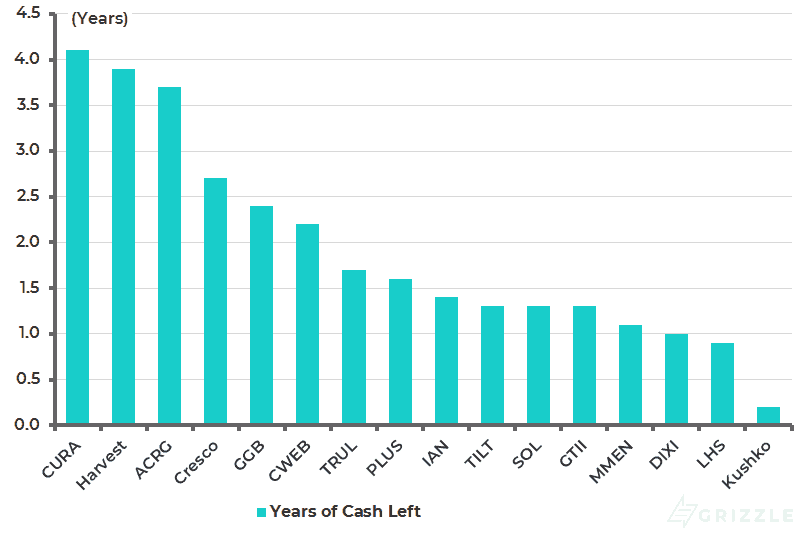
The chart below looks at each company’s cash balance in the latest quarter and their cash burn from operations plus their spending on construction of new greenhouses.
We exclude cash spent on investments because these can be cut back if the company faces a cash crunch.
This metric is really to see the cash available in a distressed situation if funding from the stock market dried up.
Most of these companies currently have plans to burn through their cash balance in less than 12 months.
Years of Cash Left at Current Burn Rate
Valuations
U.S. operators are so early in the buildout of their assets that traditional valuation measures are not very useful.
The two best metrics we’ve found to compare how the market thinks about each company is a price to sales ratio and sales per shares.
Price to Sales
All the companies are generating positive sales even if net income and EBITDA, a measure of cashflow, are negative.
Even though U.S. operators will argue otherwise, we think their business models are all very similar at this stage. Strict regulations make it hard for one company to operate any differently than the other.
We feel comfortable using top-line revenue to differentiate one company’s earnings power from the other at this early growth stage.
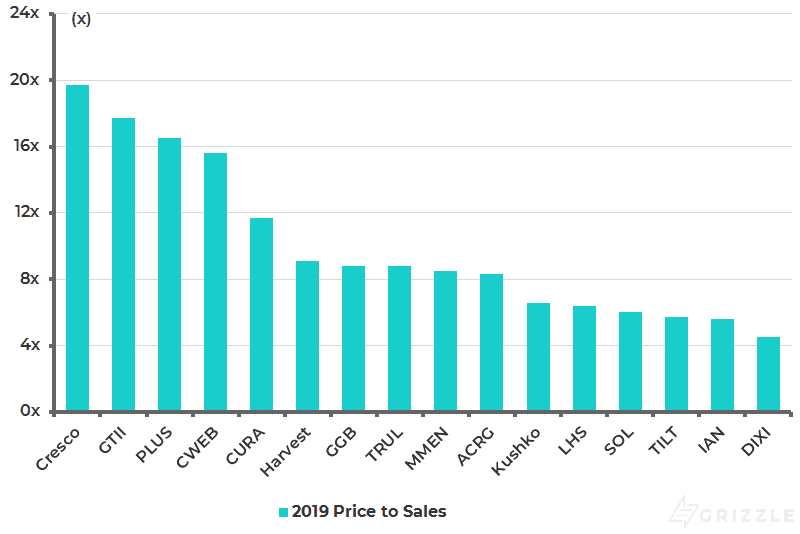
Without positive earnings to go off of, price to sales provides us with a reliable number comparing which companies are priced at a premium or a discount by the market.
2019 Price to Sales by Operator (As of 1/11/2019)
| Company | 2019 Revenue Estimate (C$MM) |
| MMEN | 390 |
| ACRG | 380 |
| CURA | 348 |
| TRUL | 278 |
| TILT | 273 |
| IAN | 234 |
| Harvest | 215 |
| CWEB | 195 |
| GTII | 161 |
| GGB | 156 |
| Kushko | 133 |
| Cresco | 130 |
| LHS | 62 |
| SOL | 56 |
| DIXI | 47 |
| PLUS | 12 |
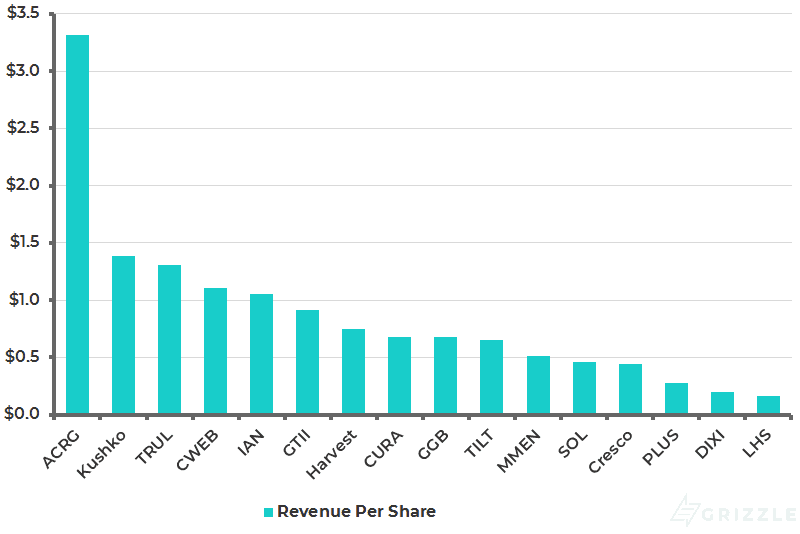
Sales per Share
Sales per share is the second, and we think most useful, piece of the puzzle as investors try to figure out which company will generate the best stock market return.
Price to sales ignores share count, however, at the end of the day an investor only owns a small piece of the company and is entitled to only a portion of the sales generated.
[su_panel background=”#150093″ color=”#ffffff” border=”0px solid #cccccc”]If company A has revenue of $100 million while company B only generates revenue of $50 million, you might think company A should have a higher stock price. But what if company A has 500 shares outstanding against company B’s 100 shares. This means company B generates revenue of $0.50/sh while company A only generates $0.20/sh. Company B’s stock price should be higher due to higher cash generation per share. Now you see the importance of share count.[/su_panel]Higher revenue per share should translate to higher earnings per share and a higher share price.
Less revenue per share today isn’t always a bad sign.
A company could have front-loaded share issuance today to fund rapid revenue growth tomorrow, however, a company with low revenue per share today has to grow much faster and execute better than peers to achieve the same level of per share profitability, all else equal.
The chart below shows you which company is generating the most revenue per share for investors based on 2019 estimated sales.
Looking at the chart, Acreage is an outlier because it was able to build a large footprint using private money and raised over $300 million in a recent IPO, funding some of the future growth.
The company will have to issue more shares to complete its entire 14 state buildout bringing it more in line with peers over 2019.
2019 Sales per Diluted Share
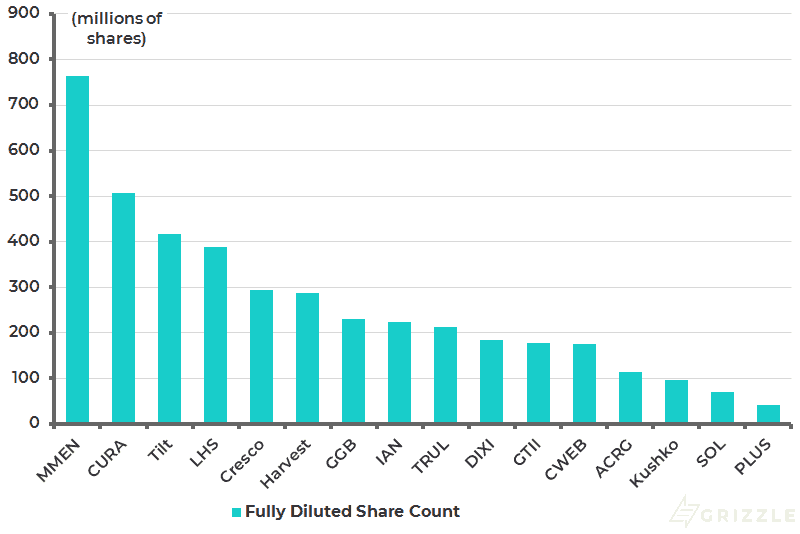
Fully Diluted Share Count
Bottom Line
Hopefully, this scorecard provides you with some useful data so you can make more informed choices about which U.S. operator is worth a potential investment.
All of these companies have an exciting story to tell, but the decisions they are making today about growth in their share count, asset footprint and revenue will determine if their share price is going up, down, or sideways over the next few years.
The most important thing you can do as an investor is separate the exciting story and hype from the actual financial results.
The marijuana scorecard should act as a tool to help you do just that.
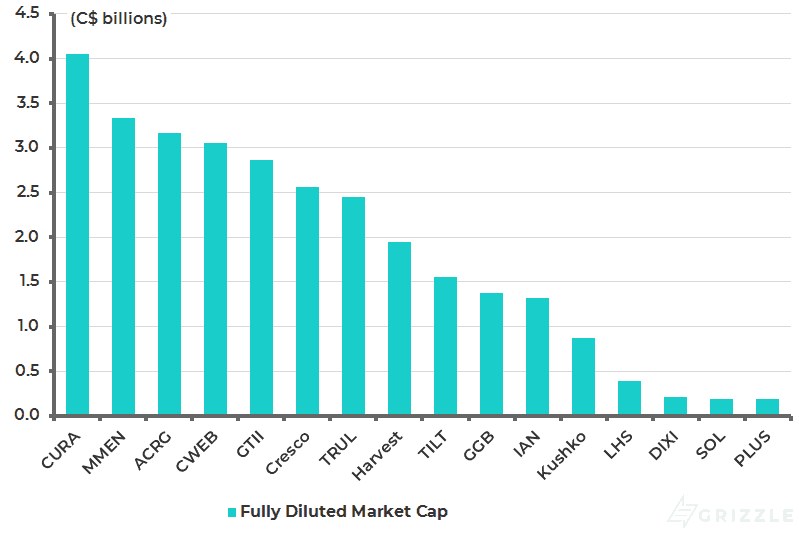
Fully Diluted Market Capitalization (As of 1/11/2019)
The opinions provided in this article are those of the author and do not constitute investment advice. Readers should assume that the author and/or employees of Grizzle hold positions in the company or companies mentioned in the article. For more information, please see our Content Disclaimer.