

Continuing last week’s subject of the momentum in the U.S. economy, the key issue remains consumption, which accounts for 68% of GDP.
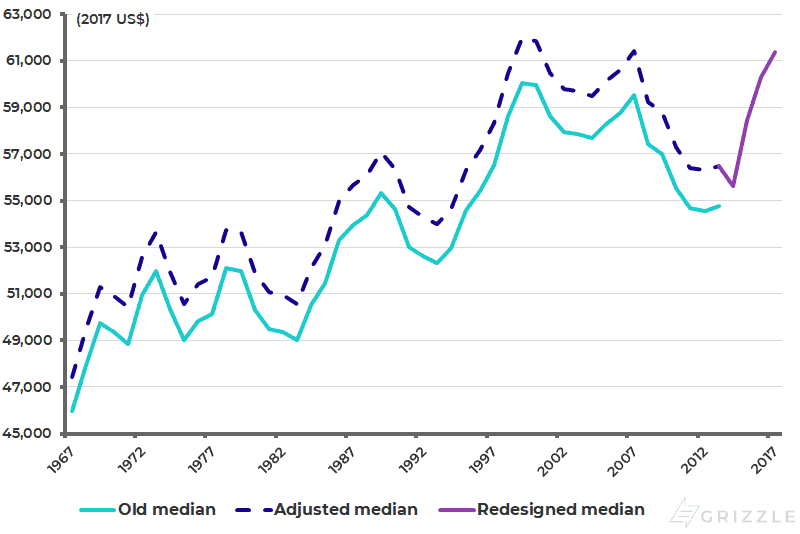
The fundamental problem for the U.S. consumption dynamic remains the extreme unequal distribution of income in America which means, to a far greater extent than is the case in western Europe or indeed Japan, that America’s middle class has been hollowed out. U.S. real median household income in 2017, the latest data available, was still 0.1% below the previous high reached in 2007 and 1.0% below the all-time high reached in 1999 (see following chart).
As an example of rising stresses, it was interesting to read recently that the Federal Housing Administration (FHA) tightened in March, underwriting standards because of rising delinquencies. Thus the FHA, which insures mortgages for first-time home buyers, told lenders that it would begin flagging more loans as high risk. The FHA reportedly said that those mortgages, many of which are extended to borrowers with low credit scores and high debt payments relative to their income, will now go through a more rigorous manual underwriting process (see The Wall Street Journal article: “FHA clamps down on risky government-backed mortgages” [paywall], March 25, 2019).
U.S. real median household income
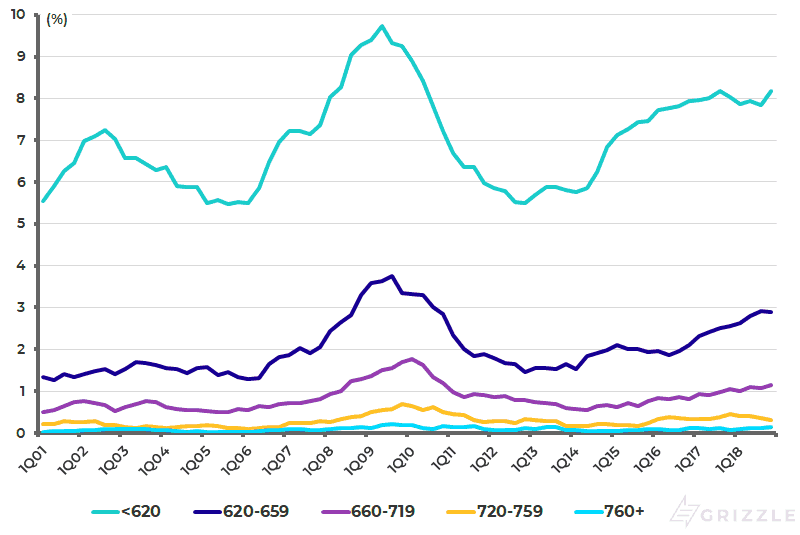
Similarly, there are growing stresses on auto loan repayments. Thus, the flow into serious delinquency (the share of auto loan balances that newly became 90+ day delinquent) rose to 2.4% in 4Q18, up from a recent low of 1.5% in 4Q12, according to the latest New York Fed’s household debt survey. More interestingly, auto loan borrowers with credit scores less than 620 saw their transitions into serious delinquency rise from 5.5% in 4Q12 to 8.2% in 4Q18 (see following chart).
Transition of auto loans into serious delinquency (90+ days) by origination credit score
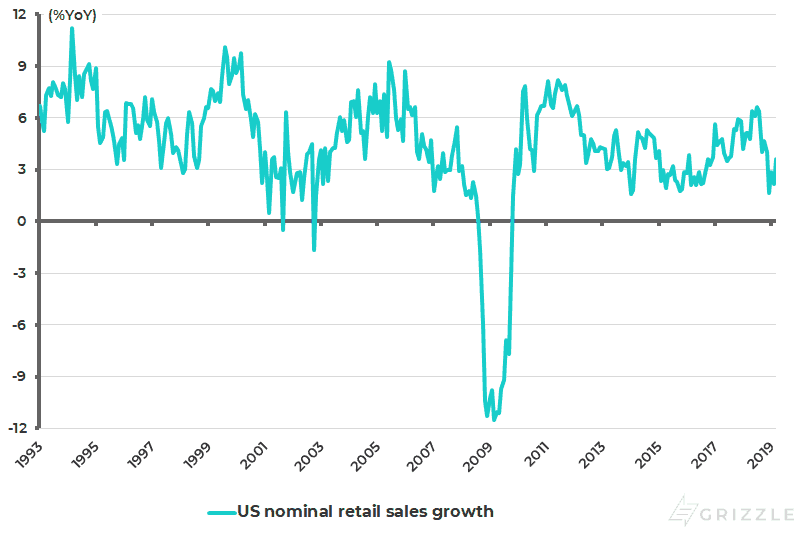
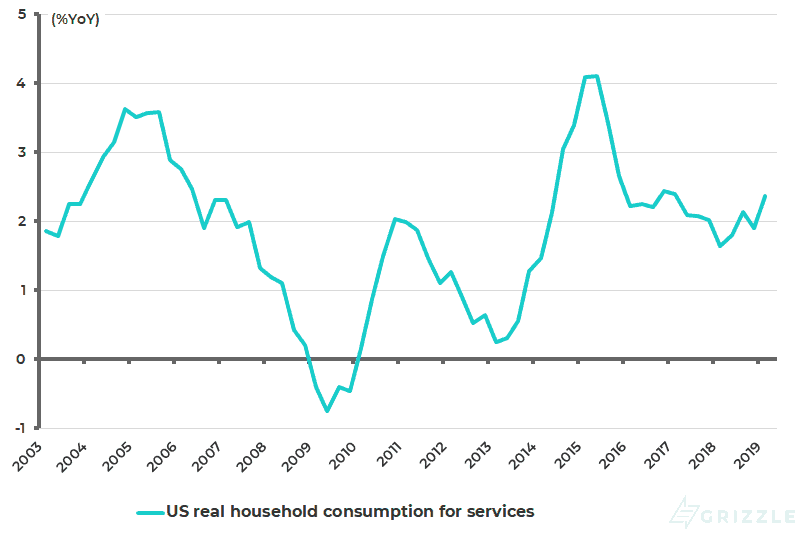
Meanwhile, the trend in retail sales and U.S. consumer spending on services remains relatively lacklustre. U.S. retail sales rose by 3.6% YoY in nominal terms in March, down from 6.6% YoY in July 2018 (see following chart). While real household consumption expenditure for services rose by 2.4% YoY in 1Q19, down from 4.1% YoY in 2Q15 (see following chart).
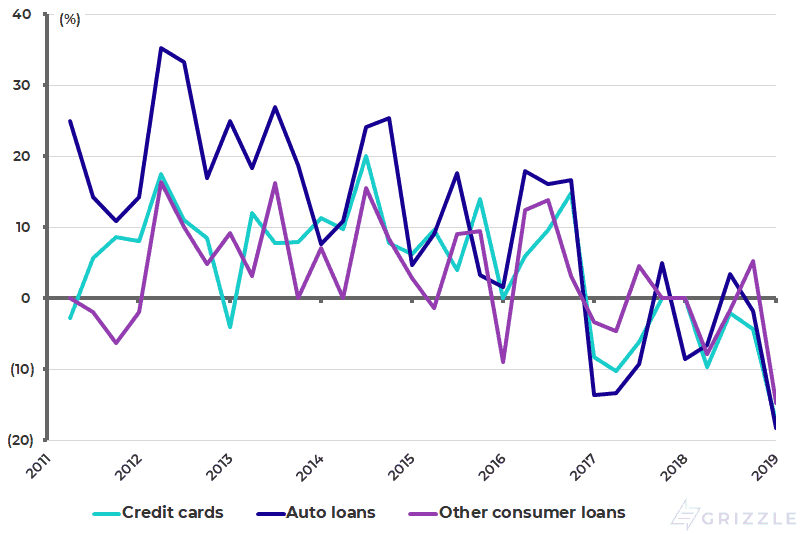
As for consumer loan demand, the Fed’s latest quarterly Senior Loan Officer Opinion Survey on Bank Lending Practices shows a net 17.4% and 18.2% of banks reporting weaker demands for credit card loans and auto loans, respectively, in January, up from 4.3% and 1.8% in October (see following chart).
U.S. nominal retail sales growth
U.S. real household consumption expenditure for services
Fed senior loan officer survey: Net % of domestic banks reporting stronger demand for consumer loans
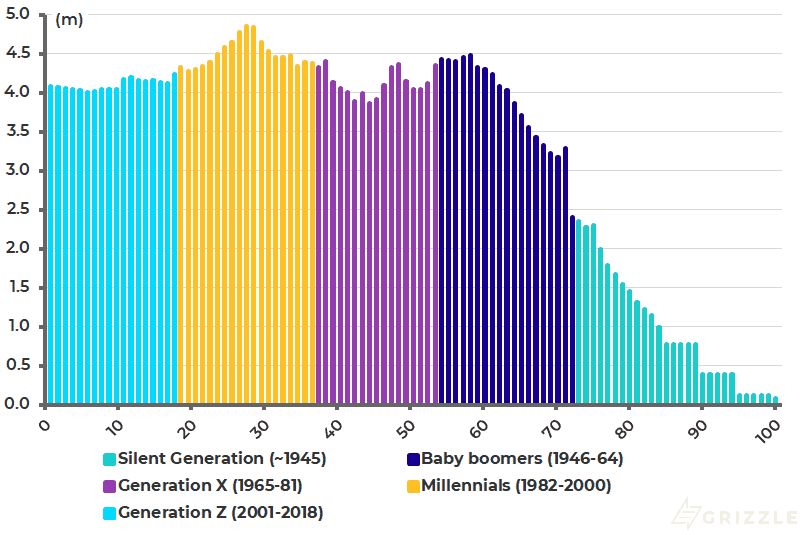
True, the bull story on the American consumer story, which has been acknowledged here previously, is that millennials are now a bigger cohort of the U.S. population than the baby boomers and they have much less debt. “Millennials”, defined as people aged between 19 and 37 (or born from 1982 to 2000), now total 85 million, compared with 74 million baby boomers, defined as those born between 1946 and 1964, according to the Census Bureau’s population estimates (see following chart).
While this is broadly true, save perhaps for student debt, which now totals an enormous US$1.5 trillion, the problem is that the boomers are entering “retirement” with a much greater debt burden than previous generations.
U.S. population by age and generation
The Burden of Debt for Aging Americans
Americans who are 60 or older owed about US$615 billion in credit cards, auto loans, personal loans and student debt as of 2017, up 84% since 2010, the biggest increase of any age group, according to the TransUnion data compiled for The Wall Street Journal (see The Wall Street Journal article: “Over 60, and crushed by student loan debt” [paywall], Feb. 2, 2019).
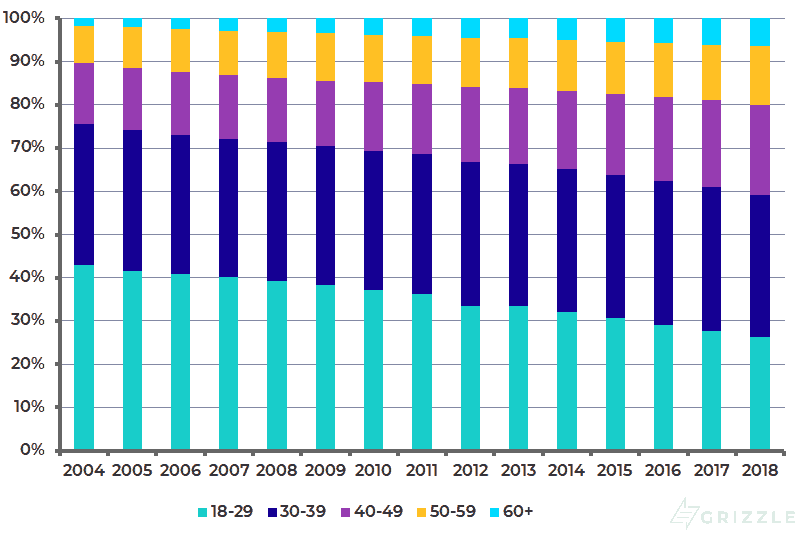
Student loan borrowers in their 60s, for example, owed an average US$33,800 in 2017, up 44% from 2010. So, student debt is spread across age groups. Thus, the New York Fed data shows that 6.5% of the student loans were owed by Americans aged 60 or above at the end of 2018, up from 1.8% in 2004 (see following chart). Indeed such data is why many baby boomers cannot afford to retire, assuming they want to.
Share of student loans by age group
Can Strong Wage Growth Balance Out Debt?
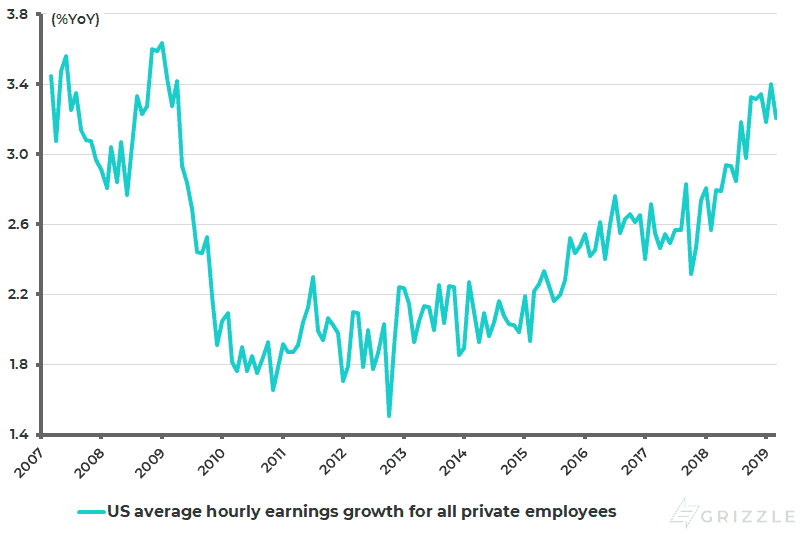
The conclusion from all of the above is that the resilience of U.S. consumption should not be taken for granted despite the seeming improving trend in wage growth. U.S. average hourly earnings growth for private employees rose from 2.3%YoY in October 2017 to 3.4%YoY in February 2019 and was 3.2%YoY in March (see following chart).
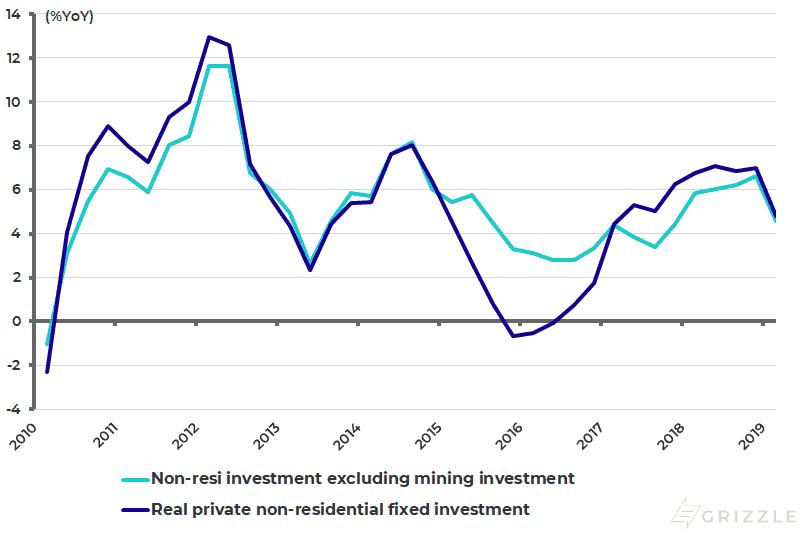
Meanwhile, the capex trend remains far from robust while share buybacks have continued to surge. Indeed surging share buybacks have been the chief beneficiary of Donald Trump’s tax reform. In terms of capital spending, real non-residential private fixed investment, excluding mining investment, rose by 4.6%YoY in 1Q19, down from 6.6%YoY in 4Q18 (see following chart).
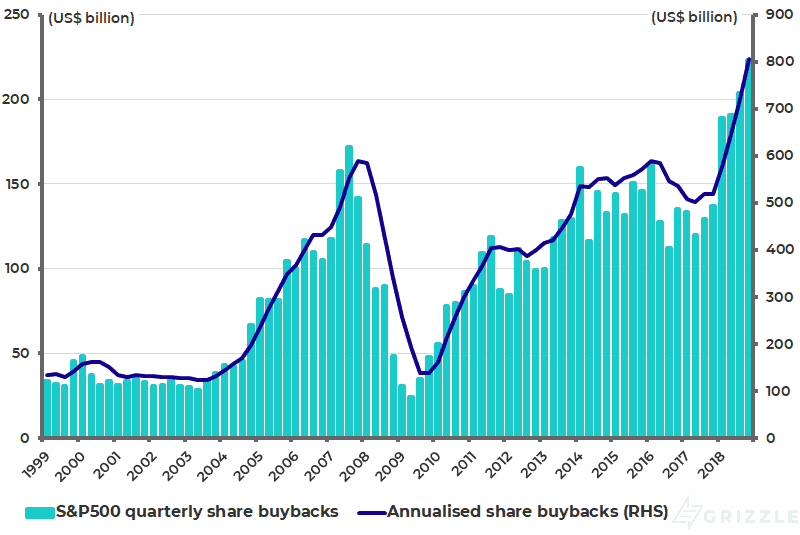
S&P500 share buybacks rose by 63% YoY to US$223 billion in 4Q18, the fourth consecutive record high. For the whole year, S&P500 share buybacks increased by 55% to a record US$806 billion in 2018, 37% above the previous record of US$589 billion reached in 2007 (see following chart).
U.S. average hourly earnings growth for private employees
U.S. real private non-residential fixed investment excluding mining investment
S&P500 share buybacks
Continuing Decline in Small Business Optimism
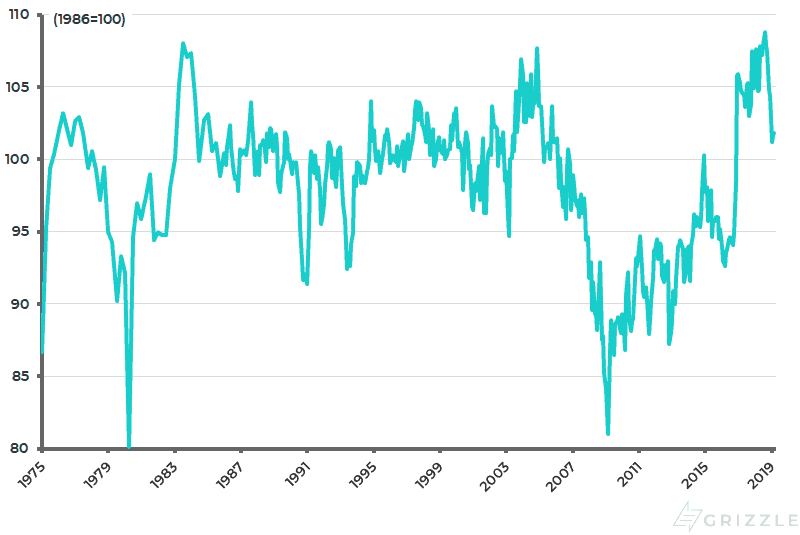
The other point to be aware of is the renewed decline in America’s NFIB Small Business Optimism Index after the spike to an all-time high which occurred last year followed Trump’s tax reform, higher than under Ronald Reagan in 1980s.
The index peaked at 108.8 in August 2018 and has since declined to a two-year low of 101.2 in January and was 101.8 in March. It is interesting to note that within the aggregate index, the components measuring capital spending plans and hiring plans are trending down again. Thus, the capex plans and hiring plans components declined from 33% and 26% in August 2018 to 27% and 18% in March. This needs to be watched closely in coming months.
U.S. NFIB Small Business Optimism Index
All of the above suggests there is a lot of potential for U.S. data to weaken in the coming quarters regardless of what happens on the U.S.-China trade dispute. If this is yet another reason for the Donald not only to agree to a deal, but also to drop the existing tariffs, it is also the case that the American president will be quick to blame the Fed if the U.S. data does indeed start to disappoint. That will, in turn, create political pressure on the Powell Fed to do what it is going to do anyway sooner or later, which is to cut interest rates.
What about the risk that the Donald’s continuing pressure on the Fed, with his comments in early April that the Fed should “drop rates”, will stop Powell from acting for fear that he no longer looks “independent”? I would not be concerned. The Fed has never in reality been “independent” of the executive, even allowing for the vaunted separation of powers under the American constitution. The reality is that G7 central banks are no more “independent” than central banks in the emerging world but their policies are a lot less orthodox than their emerging market counterparts!
The views expressed in Chris Wood’s column on Grizzle reflect Chris Wood’s personal opinion only, and they have not been reviewed or endorsed by Jefferies. The information in the column has not been reviewed or verified by Jefferies. None of Jefferies, its affiliates or employees, directors or officers shall have any liability whatsoever in connection with the content published on this website.
The opinions provided in this article are those of the author and do not constitute investment advice. Readers should assume that the author and/or employees of Grizzle hold positions in the company or companies mentioned in the article. For more information, please see our Content Disclaimer.