The other day this writer was thinking that it had become time for Donald Trump to comment on Federal Reserve policy when the news reports appeared on the remarks made late last month. The comments were, despite the usual media hype, not particularly inflammatory. Indeed since they were coming from the Donald they were remarkably mild.
Trump told CNBC that he is “not thrilled” by the Fed raising rates, though he added that he is “letting them do what they feel is best”. Still the fact remains that the news story of whether the Fed policy will be influenced by the 45th American president is now in play.
Yield Curve Flattening Shows Slight Reprieve
Meanwhile, it remains the case that Fed Chairman Jerome Powell has continued to express a lack of alarm over the most prominent market signal that the US economy might not be as robust as the Fed currently thinks. That is, of course, the flattening in the yield curve, though that flattening has moderated over the past two weeks while the 10-year Treasury futures’ net speculative short positions rose to a record high at the end of last month.
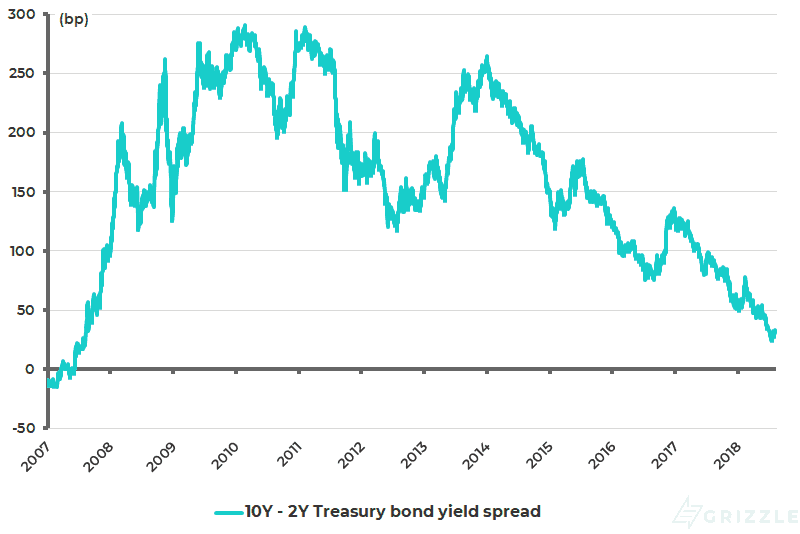
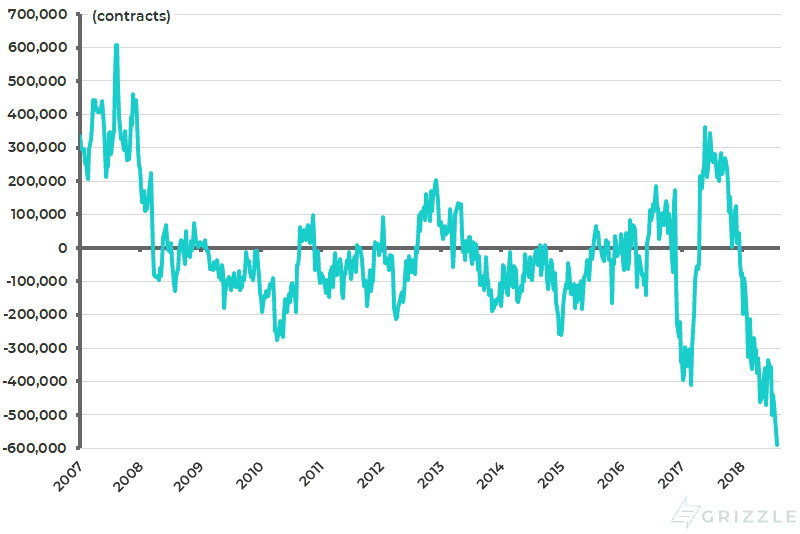
The spread between the 10-year and the 2-year Treasury bond yields declined to 24bp on July 17, the lowest level since August 2007, and has since widened to 31bp (see following chart). While the 10-year Treasury futures’ net speculative short positions rose from 335,994 contracts in mid-June to a record high of 590,128 contracts in the week ended July 31 (see following chart).
US Yield Curve (10Y-2Y Treasury Yield Spread)
CFTC CBT US 10-year Treasury Note Futures Net Speculative Long Positions
Federal Reserve Lacking Consensus on How to Manage the Yield Curve
On the specific subject of the yield curve, the Fed chairman has argued that, in order to extract the signal from longer yields about the so-called “neutral” setting for interest rates, it is necessary to adjust for the “term premium”.
This is, in theoretical terms, the premium in yield that investors in longer-term bonds demand in compensation for inflation risk. As a result, its precise level is a matter of opinion. Meanwhile, the FOMC minutes of June 12-13 reflect a clear lack of consensus on the yield curve issue. To quote from the original:
Debate Also Continuing on Managing the Fed’s Balance Sheet
It is also the case that another interesting debate on Fed policy has begun to evolve in recent weeks. That is on the question of the continuation of Fed balance sheet contraction. This writer first became aware of this reading an article in The Wall Street Journal published in early July (“Fed Faces Decisions on Shrinking Huge Bond Portfolio”, July 2, 2018).
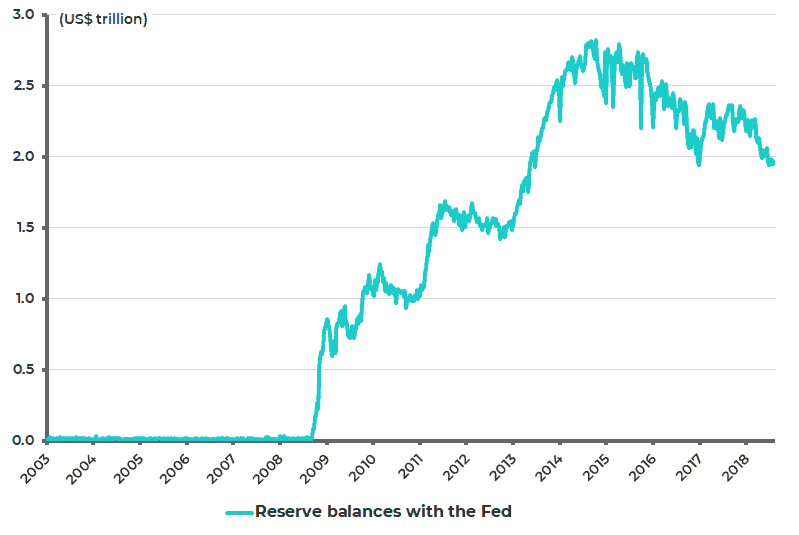
The article reported that a debate has begun inside the Fed on whether to slow down the path of quantitative tightening or to end the Fed balance sheet reduction earlier. The reason for this is that the ongoing contraction of the central bank’s portfolio is having the mechanical effect of draining “reserves” – deposits commercial banks keep on reserve with the Fed – from the system (see following chart).
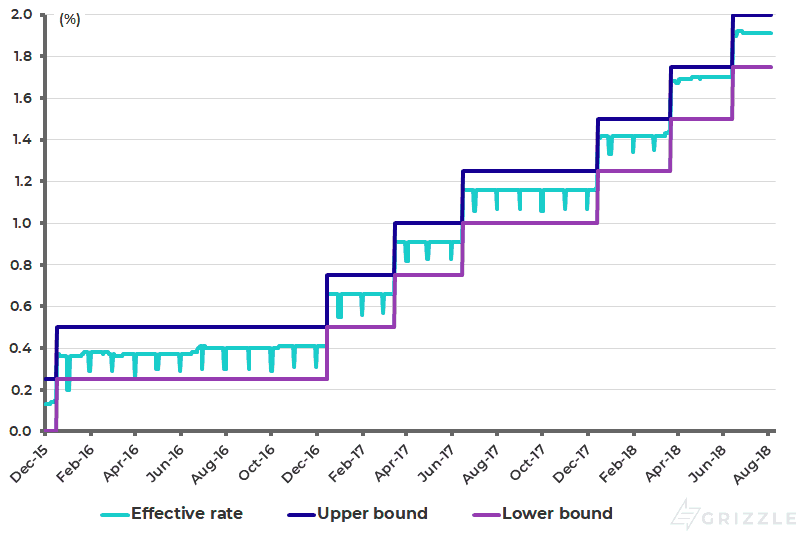
This has in turn raised the concern that this might put upward pressure on short-term interest rates. The current practice is for the Fed to keep the federal funds rate in a quarter of a percentage point range, now between 1.75% and 2%.
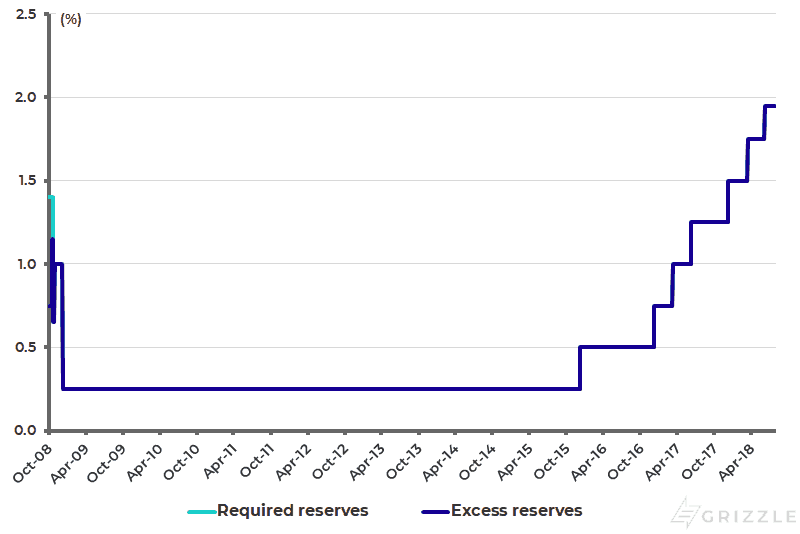
Of late, the federal funds effective rate has been trading towards the upper end of that range, running at 1.91% (see following chart). It should be noted that the Fed has been paying interest on these reserves (currently at a rate of 1.95%) since October 2008 (see following chart).
Reserve Balance with the Fed
Federal Funds Effective Rate and the Target Range
Interest Rates on Required Reserve Balances and Excess Balances
Slowing the Balance Sheet Contraction is on the Table
That there is a possibility that the Fed could slow the rate of balance sheet contraction is also suggested by comments made by Powell in Congressional testimony on July 18. Asked by Republican Chairman of the House of Representatives Financial Services Committee, Jeb Hensarling, about the time it would take to normalize the Fed balance sheet, Powell stated that it “has been” three or four years.
The Fed chairman’s use of the past tense suggests that this could be up for review. Powell also argued that the ultimate size of the Fed balance sheet would be a function of the public’s demand for currency and reserves. Still, any such potential future decision to slow the rate of balance sheet contraction will increase criticism from the political right.
Thus, Hensarling commented that there were ultimately “potential risks to the Fed’s independence of having such an unconventional sized balance sheet”, including the risk that the Fed might in future come under political pressure in future to buy certain types of bonds.
If this is criticism coming from the more free market end of the Republican Party, it can probably be safely assumed that Donald Trump will be much less focused on the relatively abstract issue of the size of central bank balance sheets.
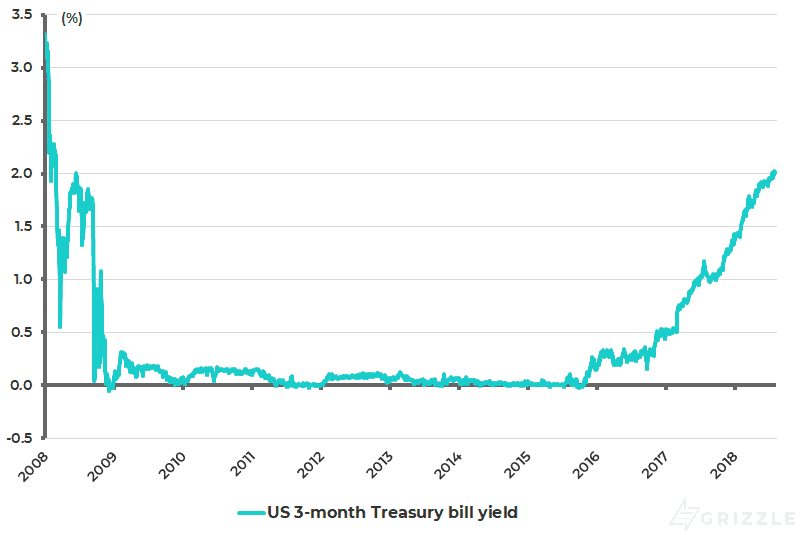
He will, however, understand the rising cost of money. This is not a point of burning contention today. Yet it is also the case that the US three-month Treasury bill yield, at a nominal rate of 2.0% (see following chart), has made US cash a legitimate asset class again for the first time since the global financial crisis, though the yield looks less compelling from a real return standpoint.
The real 3-month Treasury bill yield, deflated by core CPI inflation, is now a negative 0.2%. It is also the case that the Fed looks, for now, poised to raise rates again by another 25bp at its next FOMC meeting on September 25-26.
US 3-month Treasury Bill Yield
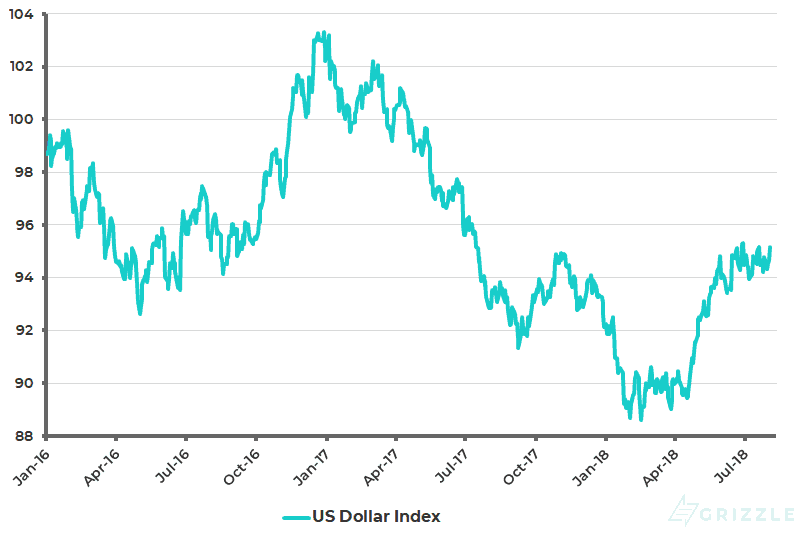
Meanwhile, despite the continuation of Fed tightening expectations with another 75bp of tightening anticipated by the money markets through to the end of 2019, the US dollar index has been trading sideways so far this quarter (see following chart). This explains the relative calm in markets of late. But the risk for financial markets, and particularly for Asian stock markets, remains another US dollar surge.
US Dollar Index
The views expressed in Chris Wood’s column on Grizzle reflect Chris Wood’s personal opinion only, and they have not been reviewed or endorsed by Jefferies. The information in the column has not been reviewed or verified by Jefferies. None of Jefferies, its affiliates or employees, directors or officers shall have any liability whatsoever in connection with the content published on this website.
The opinions provided in this article are those of the author and do not constitute investment advice. Readers should assume that the author and/or employees of Grizzle hold positions in the company or companies mentioned in the article. For more information, please see our Content Disclaimer.