
China has gone from closet Covid easing over the Christmas holiday to a full-scale U-turn and is now essentially pursuing herd immunity with the latest anecdotal evidence that some of the largest cities have already seen a peaking-out in infections.
On 26 December, in an important symbolic move, the disease was renamed by China’s National Health Commission from “novel coronavirus pneumonia” to “novel coronavirus infection”, while the management of Covid-19 has been downgraded from 8 January from the top-level Class A to the less-strict Class B.
As a result, China has stopped imposing from 8 January quarantine measures on infected people domestically as well as on arrivals from abroad.
Covid tests on arrival in China are also scrapped, though travellers still need to present a negative PCR test result within 48 hours before departure.
Similarly in Hong Kong Chief Executive John Lee announced on 24 December, following his return from a four-day visit to Beijing when he met with Chinese President Xi Jinping, that the government aims to reopen “gradually and orderly” the borders between mainland China and Hong Kong as soon as mid-January.
Indeed, the borders have started to reopen from 8 January with an initial limit of 60,000 persons per day.
Meanwhile, virtually all remaining Covid restrictions in Hong Kong have now been removed, though in an eccentric move it will still be compulsory to wear masks in the territory.
Arrivals will from today no longer be required to conduct mandatory PCR tests while the city’s vaccine pass will also be scrapped.
Emerging Markets at a Discount to the US with Catalysts
The above dramatic policy change means that the Chinese economy should be back to normal by the second quarter, if not earlier.
They also increase the likelihood that the emerging market equity asset class has made a major bottom against both the S&P500 and the MSCI AC World Index.
MSCI Emerging Markets relative to S&P500 and MSCI AC World
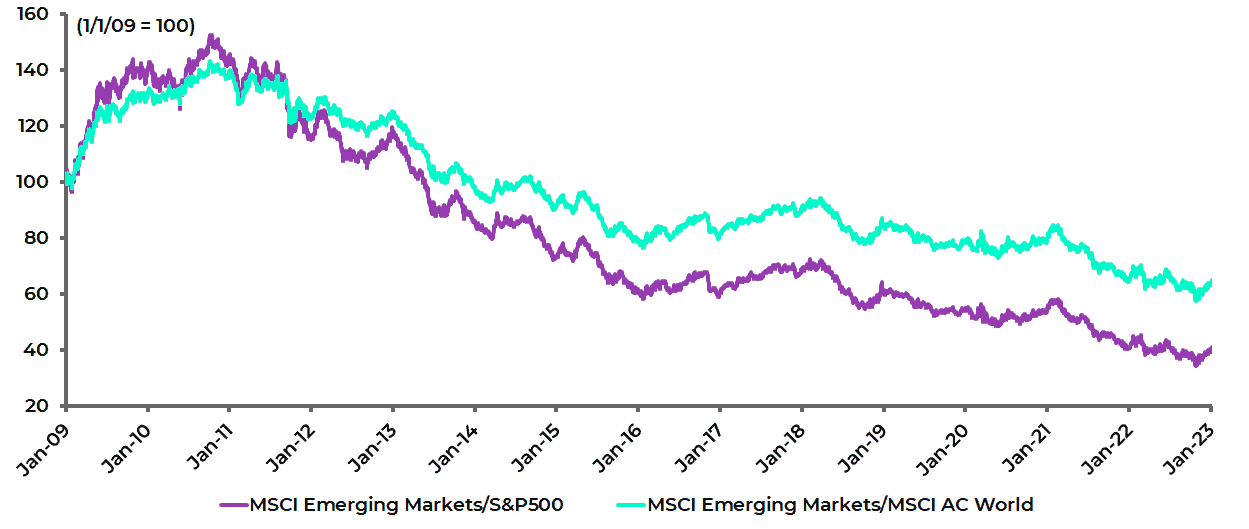
The case for emerging is based on the positive earnings upgrade potential for several Asian markets this year, most particularly China, and the growing risk of earnings downgrades in the US in 2023.
The MSCI AC Asia ex-Japan Index is now trading on 12.95x 12-month forward consensus earnings, or a 26% discount to the MSCI USA’s 17.4x forward PE.
MSCI AC Asia ex-Japan 12m forward PE relative to MSCI USA 12m forward PE

Apple Looking Vulnerable
Meanwhile, Apple has been looking increasingly vulnerable as the “last man standing” of the FANNGM complex with its share price down “only” 29% from the peak reached in early January last year when it was capitalized at US$2.99tn.
Apple Inc. market capitalisation
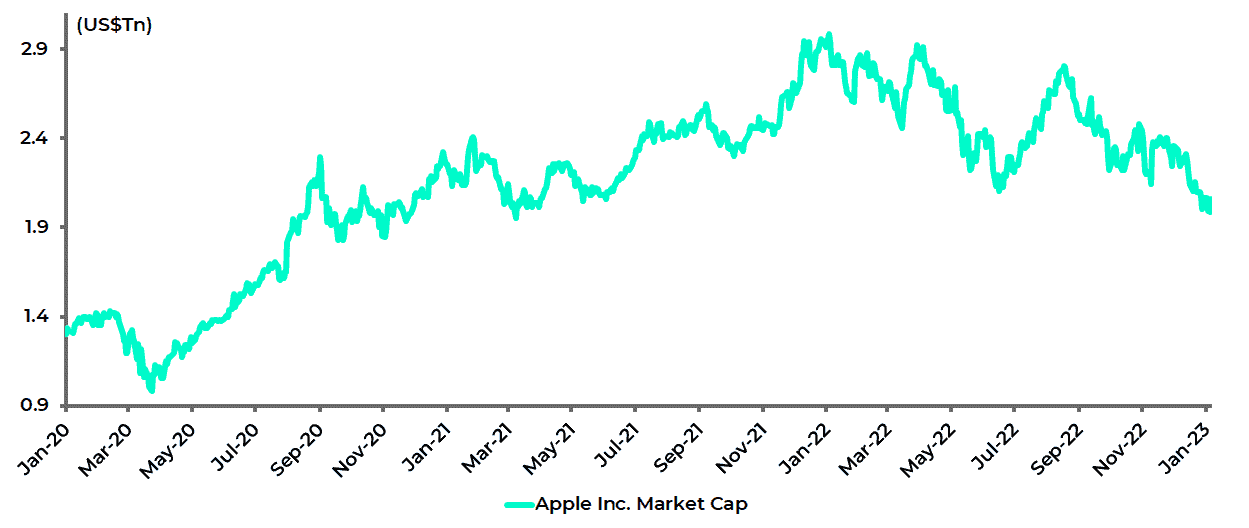
But with its market capitalisation now US$2.06tn, Apple is still capitalised at more than many individual stock markets.
For example, total stock market capitalisations in Switzerland, Korea and Taiwan are now US$1.93tn, US$1.64tn and US$1.64tn respectively and are a combined US$1.43tn in the case of Indonesia, Thailand and the Philippines.
The bullish argument for US equities is a growing conviction that inflation has peaked, combined with mounting hopes that America can avoid a recession this year.
If that is the story, this writer would agree that the peaking-out-of-inflation viewpoint has much more to commend itself now than was the case last summer last year when the same theme drove a counter-trend rally before the US stock market turned down again in August.
Avoiding a US Recession Will be Difficult in our View
Still this writer is much less convinced of the avoidance of the recession story.
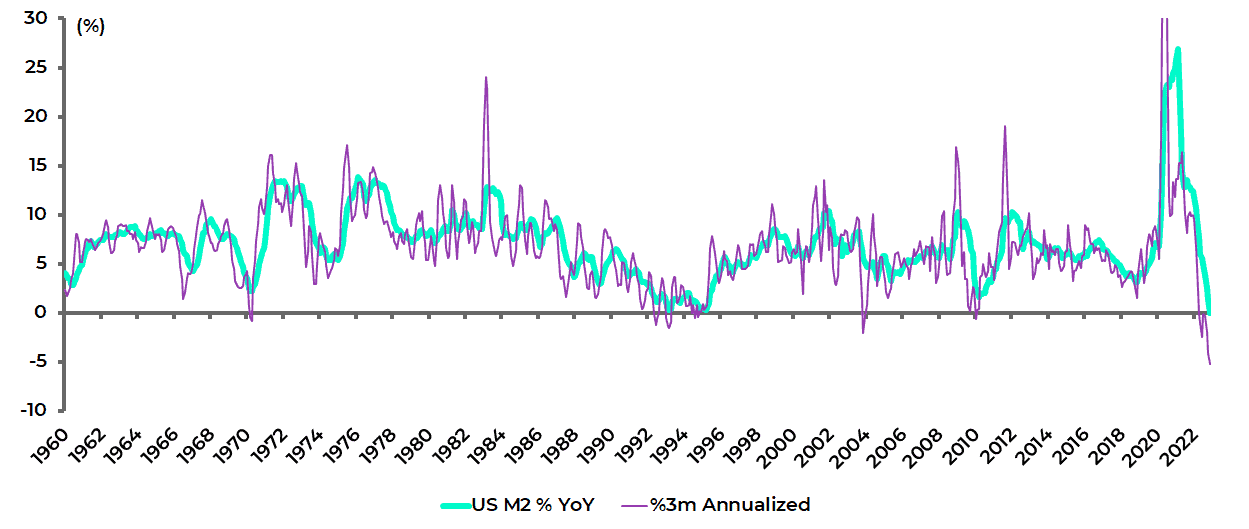
The base case for a recessionary outcome remains the simple point that this has been the most aggressive monetary tightening cycle since the early 1980s with America now facing the sharpest decline in broad money supply growth on record.
US M2 has declined by an annualised 5.2% in the three months to November, the biggest three-month decline since the data series began in 1959.
While on a year-on-year basis, M2 growth slowed from 26.9% YoY in February 2021 to 0.0% YoY in November, again the slowest growth rate since the data series began in 1959.
US M2 growth
The other point remains that the financial position of American households is far less healthy than it was at the start of last year as the accumulated savings from the Covid-triggered transfer payments are incrementally spent.
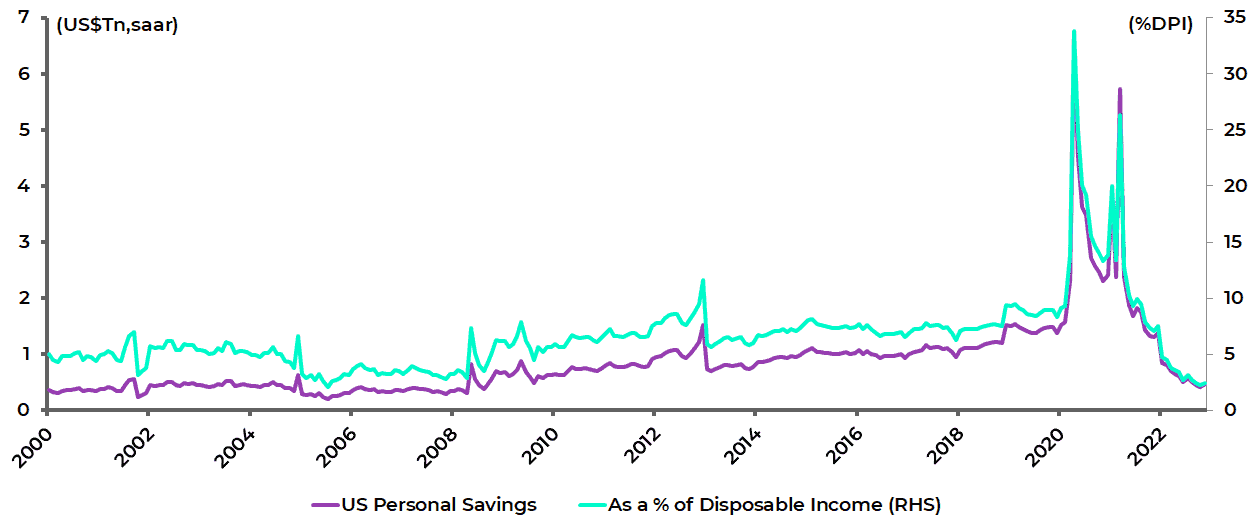
This can be seen both in terms of the decline in personal savings as a percentage of disposal income and also in dollar terms.
The numbers are quite dramatic.
The personal savings rate has declined from 9.5% of disposable income in August 2021 to 2.2% in October 2022, the lowest level since July 2005, and was 2.4% in November.
While in dollar terms, personal savings have collapsed by US$1.34tn or 76% from an annualised US$1.75tn in August 2021 to US$419bn in October, the lowest level since August 2008, and were US$461bn in November.
US personal savings
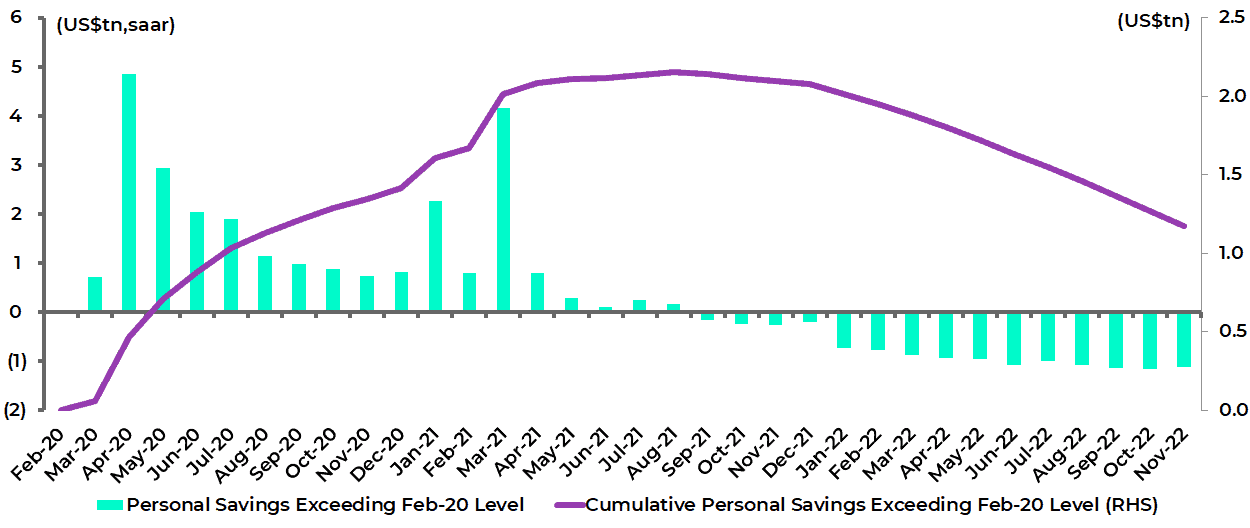
On this point, it should be noted that US personal savings have since August 2021 declined below the pre-Covid level prevailing in February 2020.
One simple way to measure “excess personal savings” is to calculate the gap between US monthly personal savings during the pandemic and the pre-pandemic level in February 2020.
Based on this methodology, cumulative excess personal savings since March 2020 at the onset of the pandemic rose to a peak of US$2.15tn in August 2021 and have since declined by US$979bn or 45% to US$1.17tn in November.
US cumulative “excess personal savings”
In this respect, it is worth noting that a US Census Bureau survey published on 5 January found that 40% of American households face problems paying for essential household expenses compared with 26.7% in August 2021.
Percentage of US Households Finding it Difficult to Pay for Household Expenses
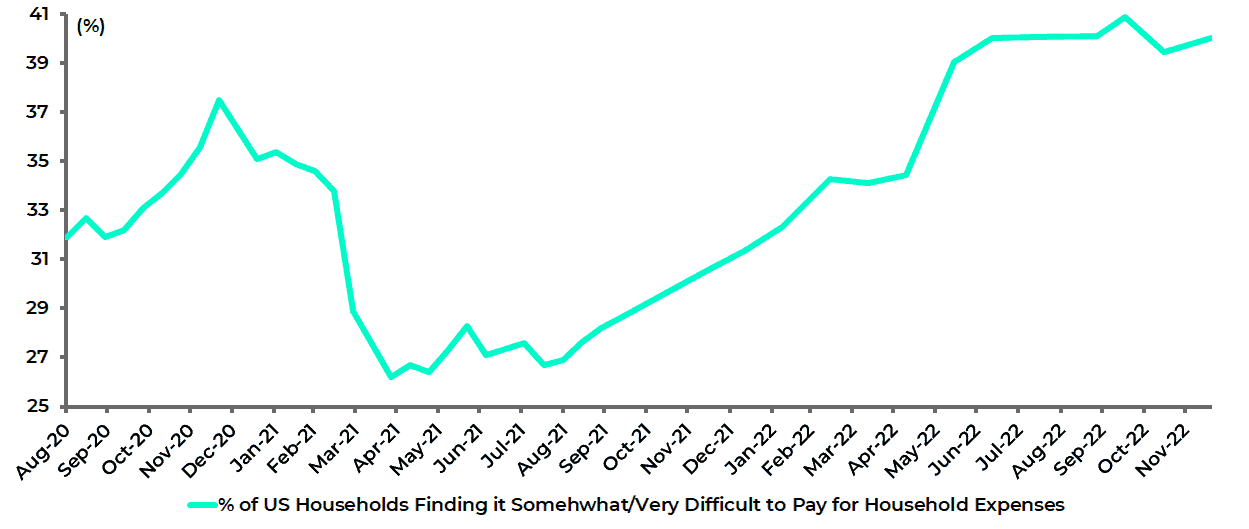
Source: US Census Bureau – Household Pulse Survey
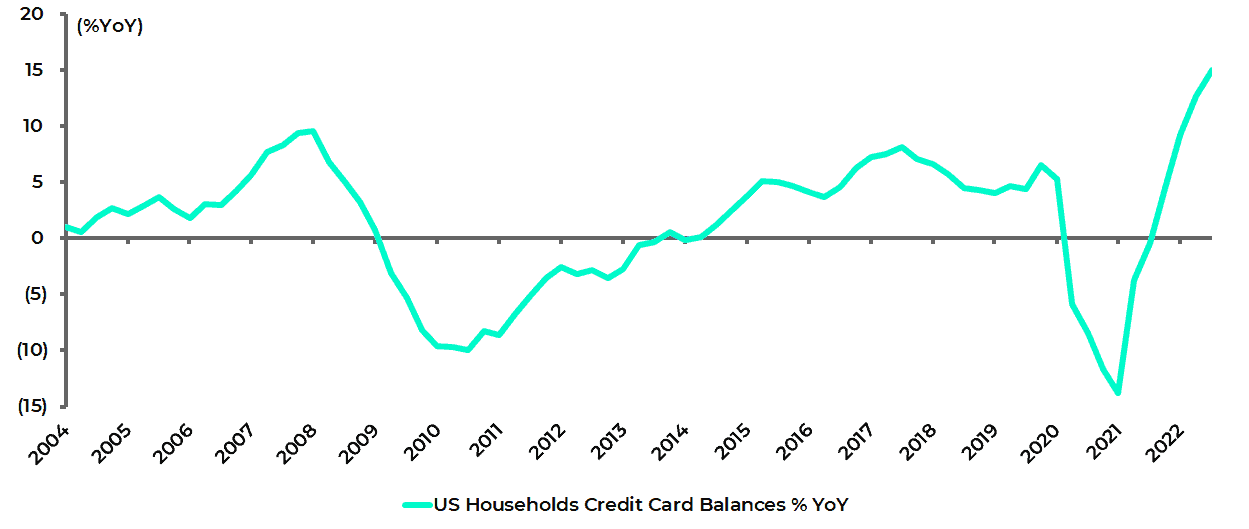
It is also the case that credit card balances rose by 15% YoY in 3Q22, the biggest increase since the data series began in 2003, according to the New York Fed’s quarterly Household Debt and Credit report.
The average interest rate being charged on that balance is an onerous 19.8%.
US household credit card balances %YoY
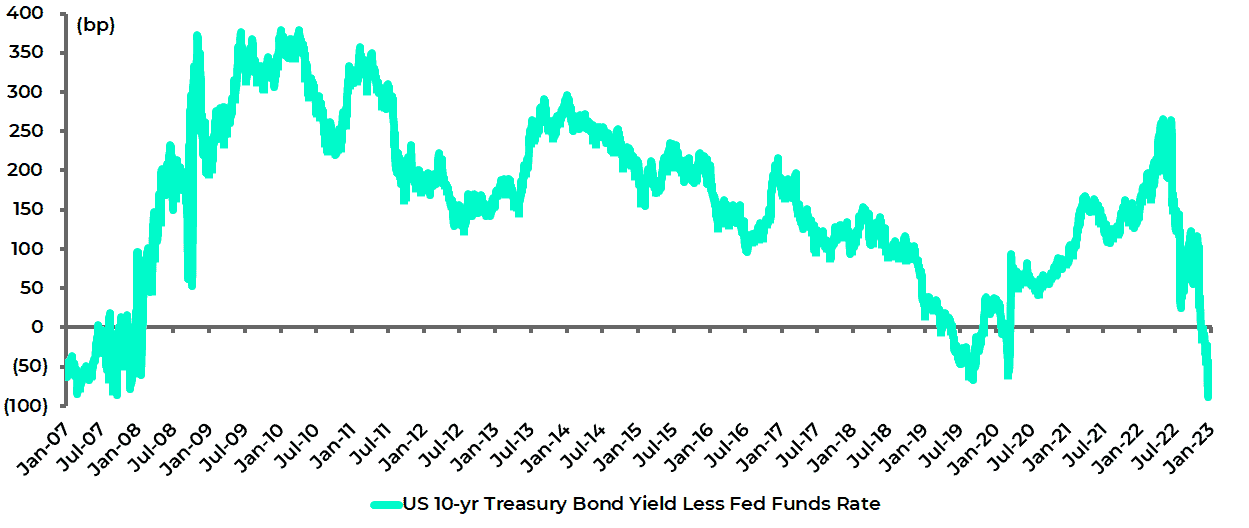
Meanwhile the yield curve that really matters, by which this writer means the relationship between the federal funds rate and the 10-year Treasury bond yield, is now properly inverted for the first time in this tightening cycle.
The spread between the 10-year Treasury bond yield and the federal funds effective rate has declined from 116bp in late October to a negative 88bp in mid-December, the most inverted position since 2007, and is now a negative 77bp.
US yield curve: 10-year Treasury bond yield less Fed funds effective rate
All this is further evidence of the growing likelihood of a recession in the US in 2023, though it should be remembered that monetary policy works with a lag.
That creates the likelihood of a fudging of the 2% inflation target once it becomes clear that the economy has turned down and the political pressures change accordingly.
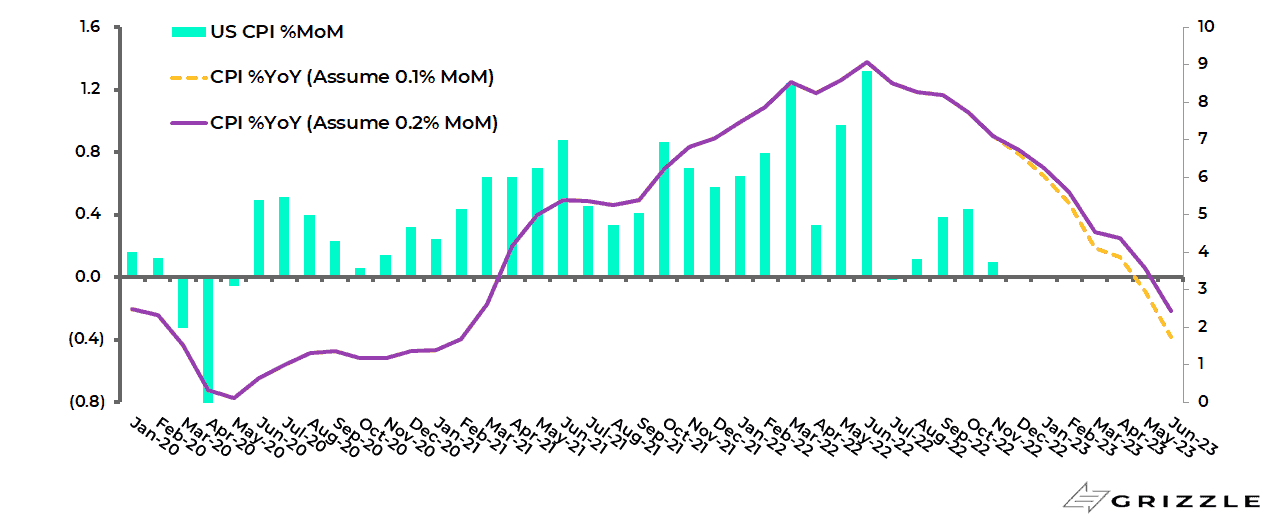
Still inflation readings could also be heading down sharply because of the positive base effects on US CPÏ in the first six months of this year. On this point, CPI averaged 0.8% MoM increases in the period between December 2021 and May 2022 and peaked at 1.3% MoM in June 2022.
The implications of this positive base effect can be illustrated by the following hypothesis.
If CPI rises by 0.1% MoM for the next six months, (i.e. a repeat of what happened in November) CPI falls to 3.0% YoY in May and 1.7% YoY in June.
If month on month increases are 0.2% CPI still falls to 3.6% and 2.4% YoY in May and June.
US CPI inflation projections assuming 0.1%MoM or 0.2%MoM increases going forward
The views expressed in Chris Wood’s column on Grizzle reflect Chris Wood’s personal opinion only, and they have not been reviewed or endorsed by Jefferies. The information in the column has not been reviewed or verified by Jefferies. None of Jefferies, its affiliates or employees, directors or officers shall have any liability whatsoever in connection with the content published on this website.
The opinions provided in this article are those of the author and do not constitute investment advice. Readers should assume that the author and/or employees of Grizzle hold positions in the company or companies mentioned in the article. For more information, please see our Content Disclaimer.