



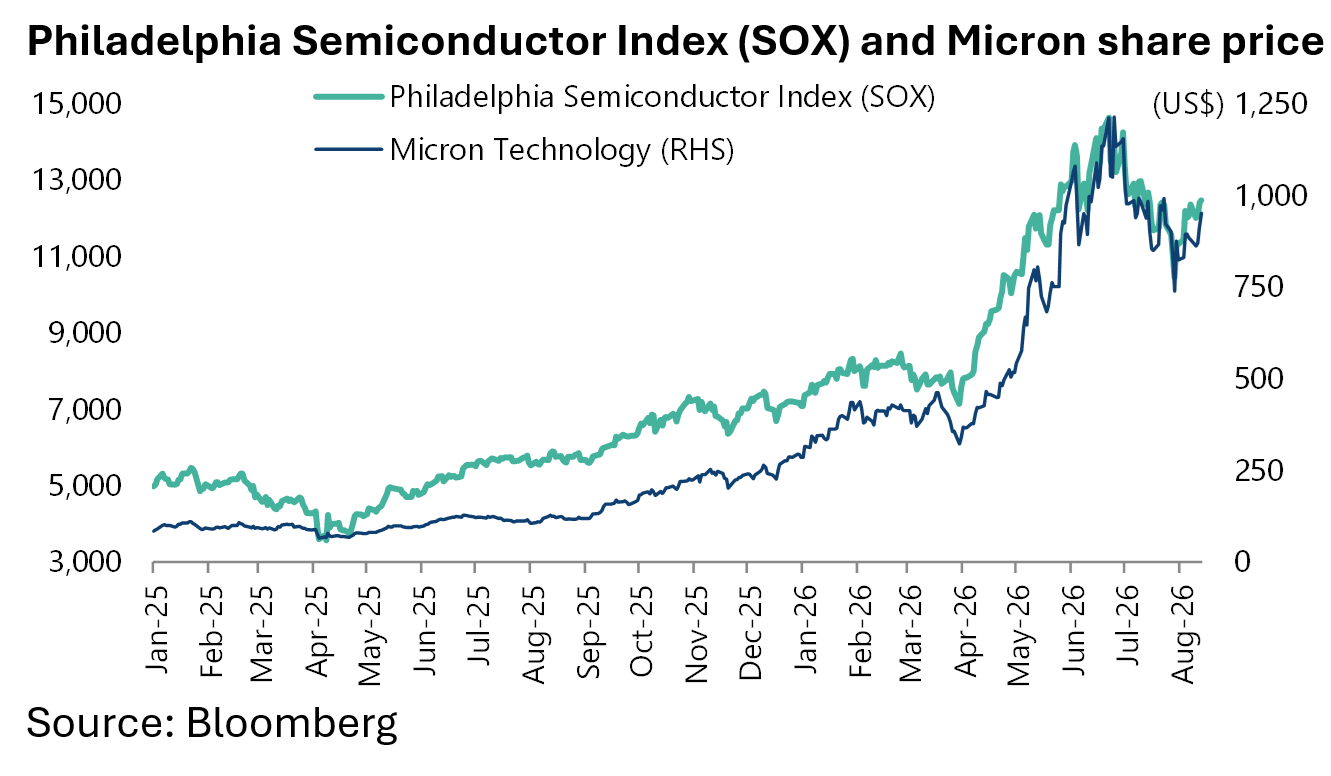
The hyperscalers have now reported after the SOX index suffered a 21% decline in July, with Micron down 41% from peak to trough.
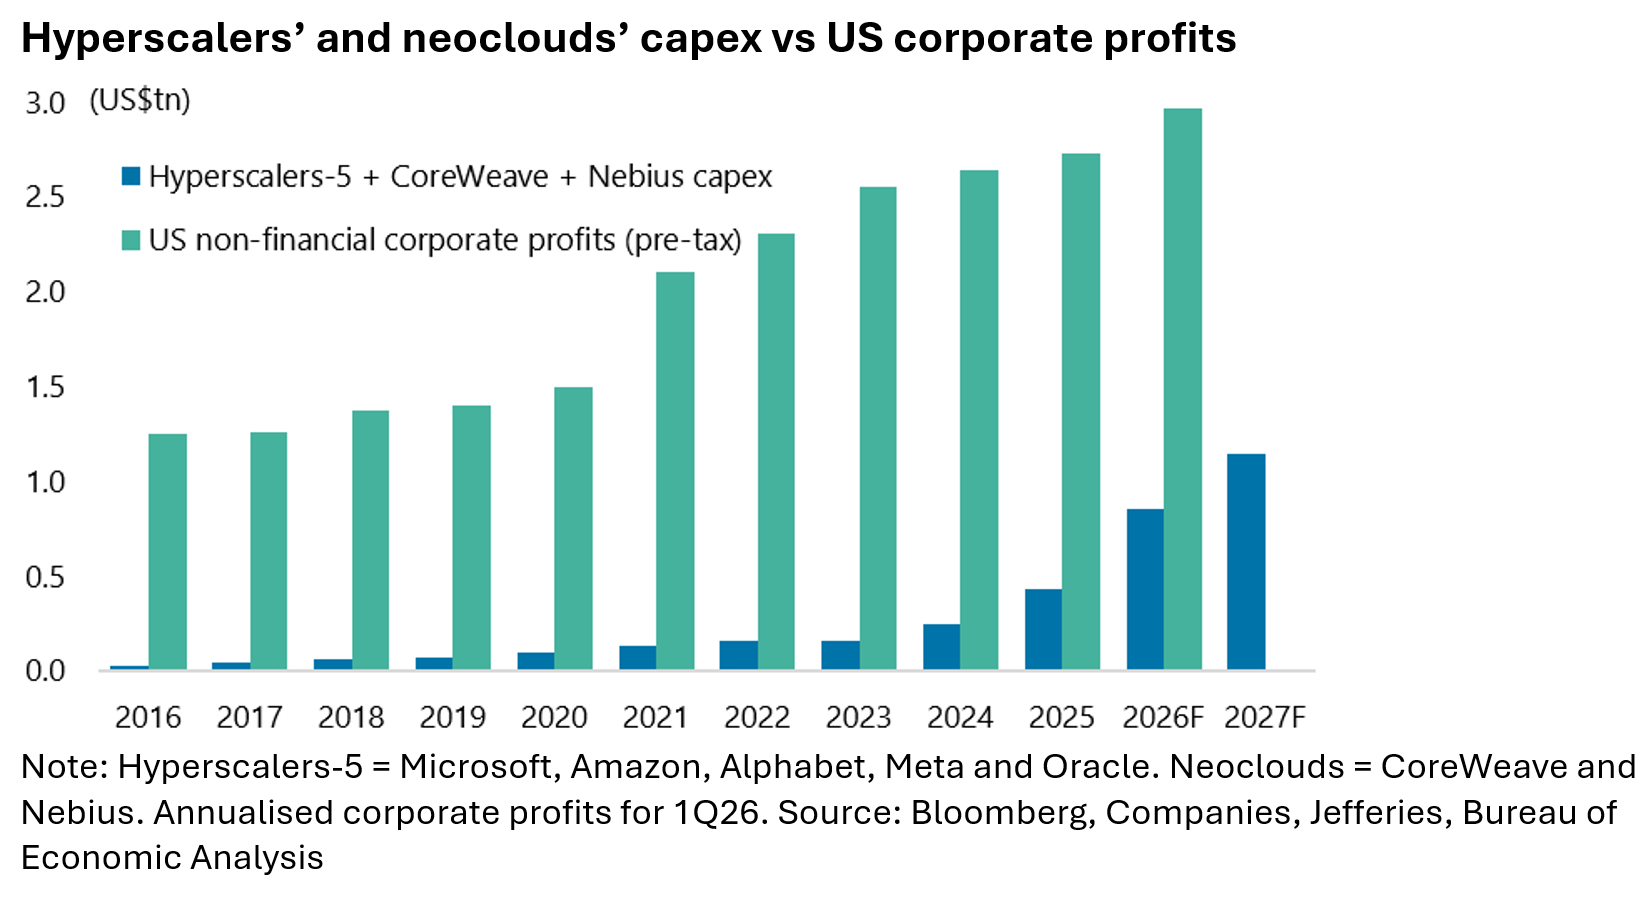
But the AI capex remains ongoing with the market now expecting capex of about US$860bn this year by the major AI-related US tech players and another US$1.15tn next year depending on the number of tech companies included in the aggregate.
Those figures are based on the five major hyperscalers and neoclouds CoreWeave and Nebius.
This capex number for 2027 represents about 3.5% of US nominal GDP and about 25% of US non-residential fixed investment to give some kind of macro perspective.
It is also, remarkably, equivalent to 39% of annualised total non-financial pre-tax profits of all US companies, not just listed ones, of US$2.97tn in 1Q26 based on national accounts data.
The best reason to believe the AI capex arms race is close to peaking is that it is eating up a growing percentage of hyperscalers’ cash flow.
Thus, based on the latest company capex guidance announced in late July, the four major US hyperscalers’ capex as a percentage of operating cash flow has risen from 41% in 2023 to a projected 99% in 2026.
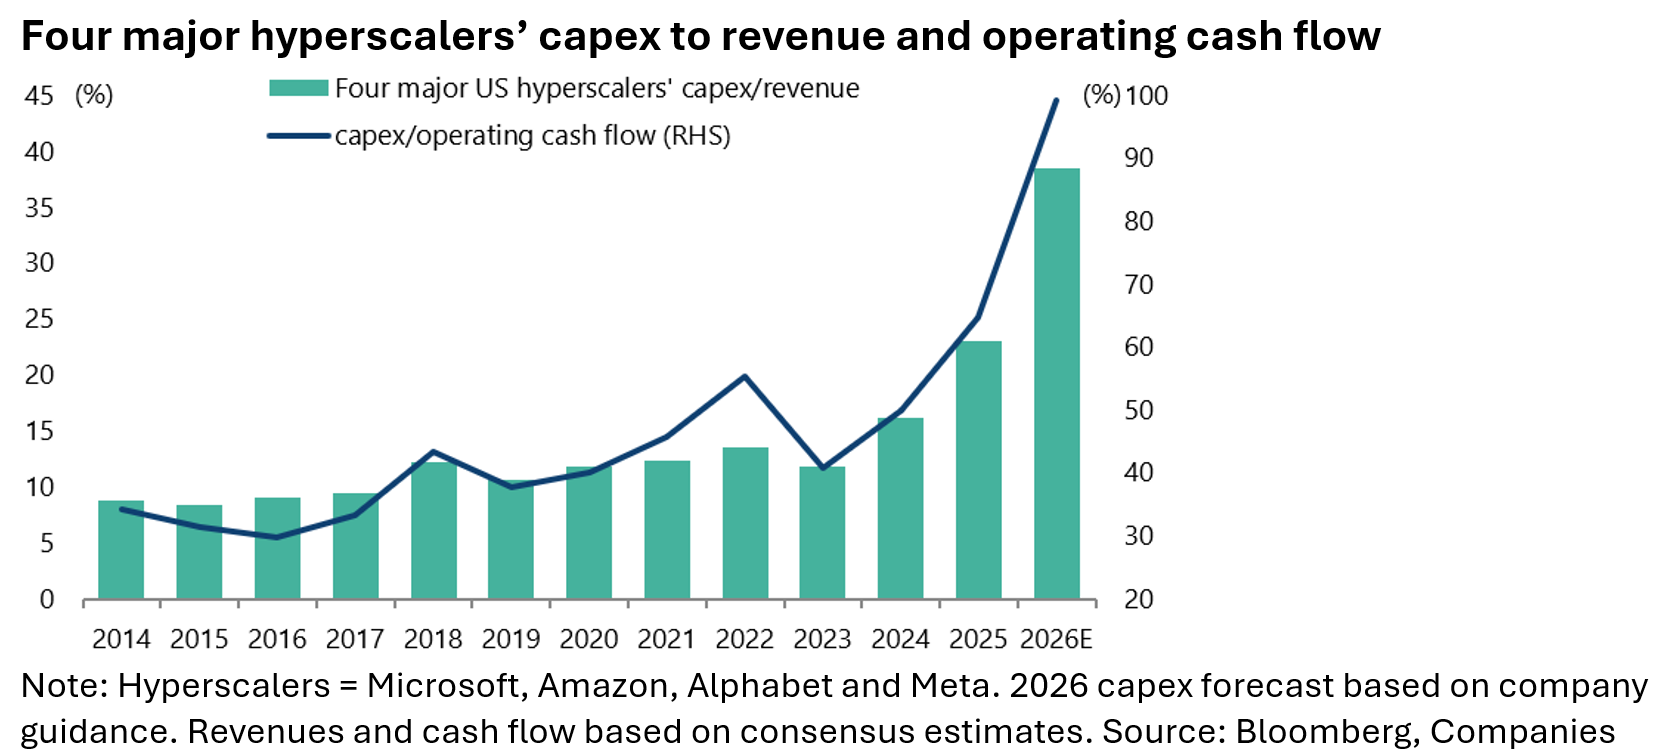
This number is derived from consensus estimates of revenues and operating cash flow.
That suggests the four US hyperscalers will spend about 30% of their operating cash flow on memory this year assuming that memory will consume about 30% of hyperscalers’ total capex.
US Models Are Losing Market Share to China
The other issue, of course is the question of the monetisation of AI, or the lack of it from the standpoint of the large language models.
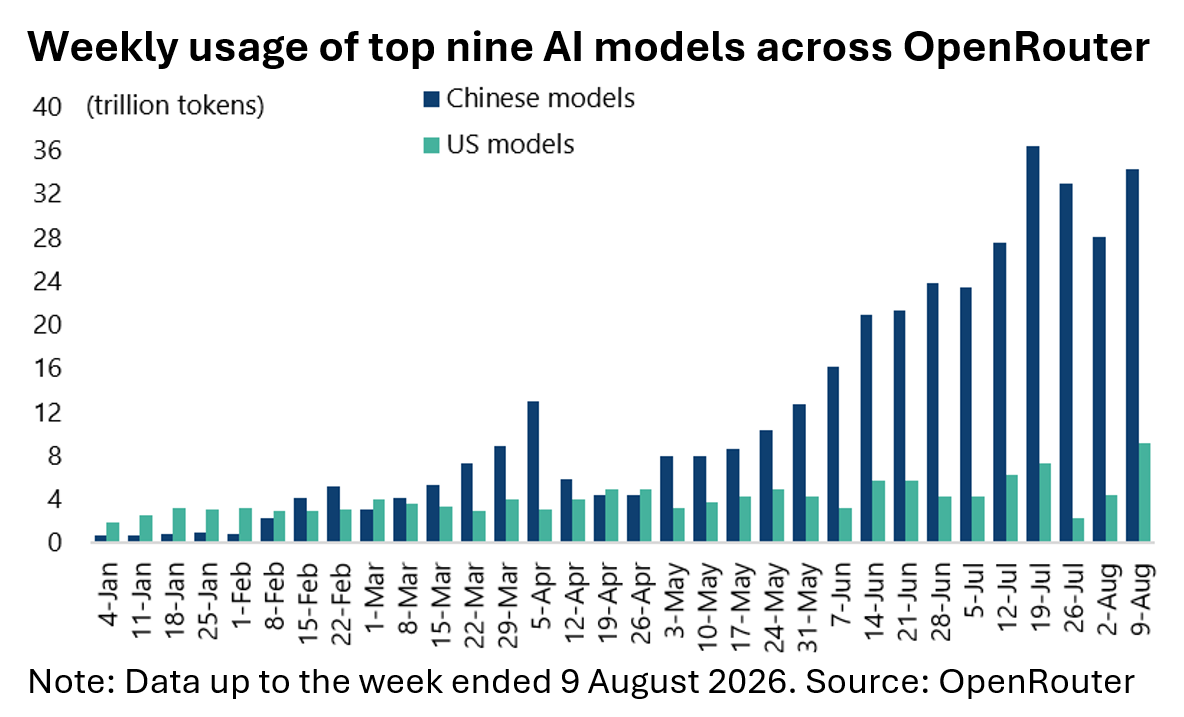
In this respect, cheap China open source models continue to take market share.
The top Chinese AI models processed 34.25tn tokens on the global aggregator platform OpenRouter in the week ended 9 August, up from 4.37tn in late April.
This compared with 9.17tn tokens for the top US models, based on the weekly usage of the top nine models on OpenRouter.
In this context, the rising investment required to maintain leadership in this game due to rising compute, memory and power costs will likely mean sustainable profitability is far away for pure model players.
The news in late June that OpenAI is considering delaying its IPO, previously planned for this year, should be seen in this context.
AI Profitability Could Look Like the Airline Industry, But for now, Hyperscaler Growth is Accelerating.
Indeed the base case of this writer remains that AI will turn out to be much more like the capex-intensive airline industry than the winner-takes-all network effect of the Internet economy.
Still it is also the case that Alphabet, Microsoft and Amazon, though not as yet Meta, are all direct beneficiaries of AI spending via their cloud computing divisions.
For example, Amazon’s cloud computing unit, Amazon Web Services (AWS), generated US$42.2bn in revenue in 2Q26, up 37% YoY, the fastest growth in 18 quarters.
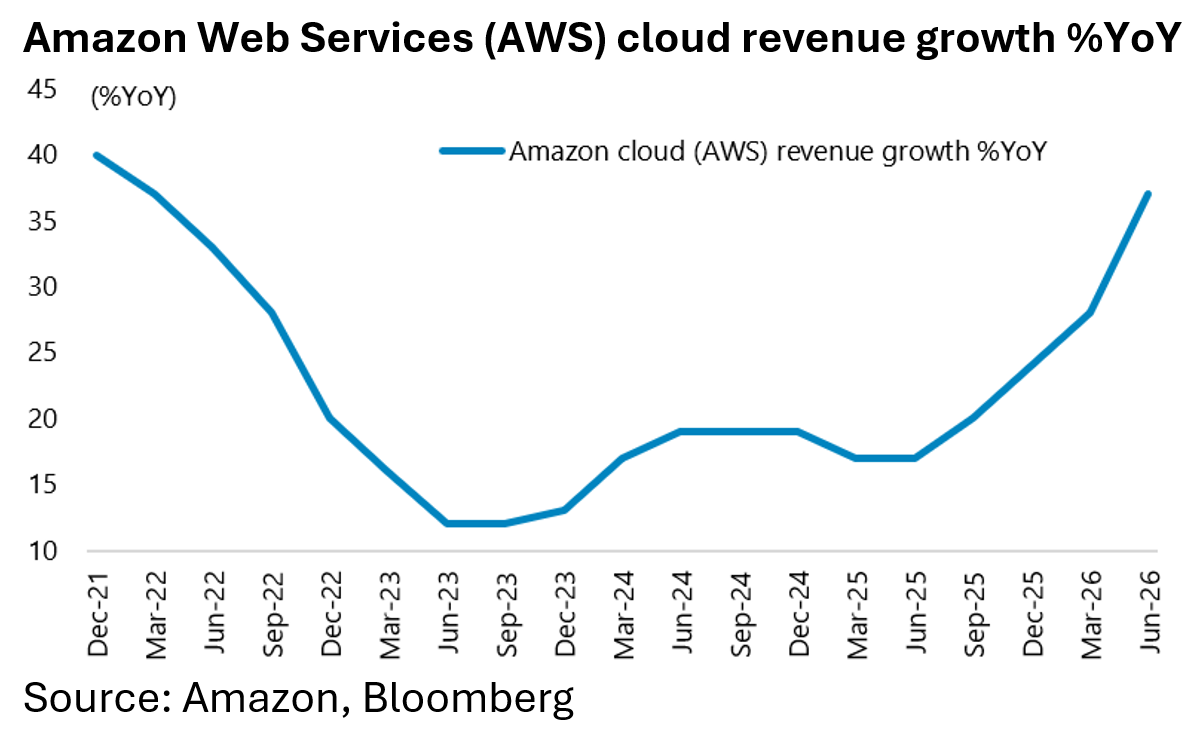
This is the main reason why the Amazon results were treated positively by investors even though capex guidance was also raised.
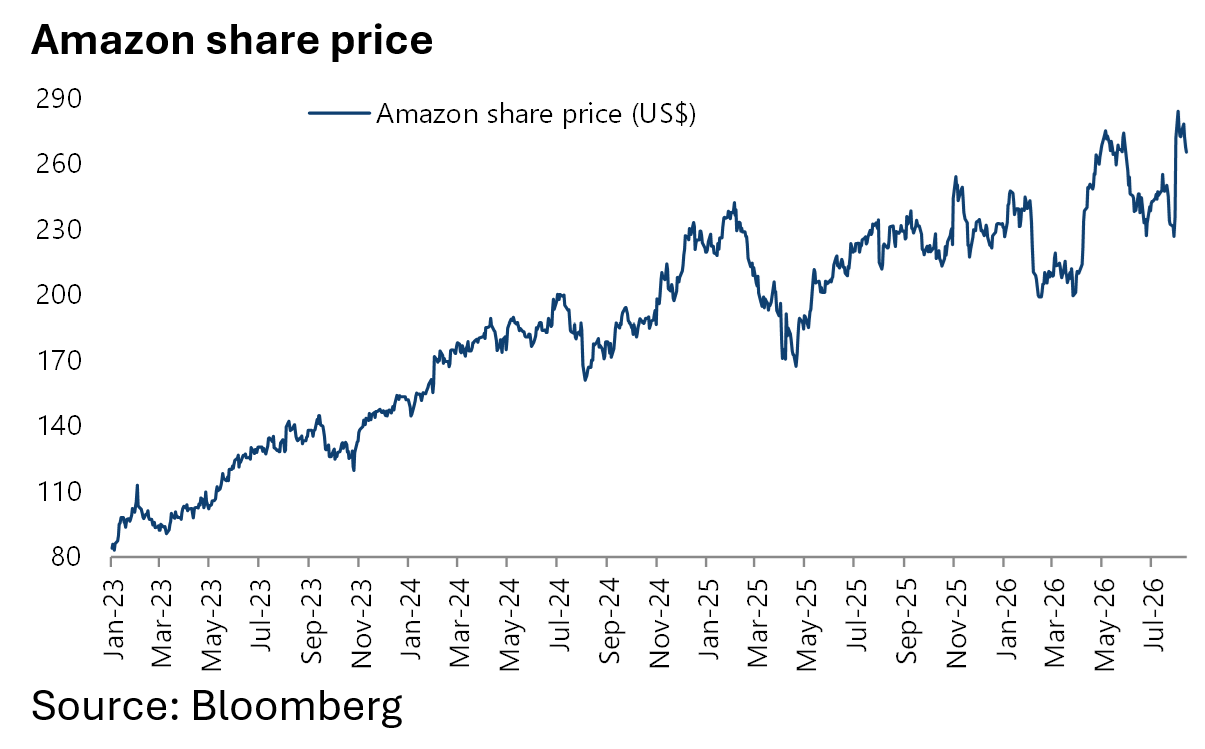
Amazon’s share price rose by 15% the day following the result announcement on 30 July when it raised its 2026 capex guidance from US$200bn to US$220bn.
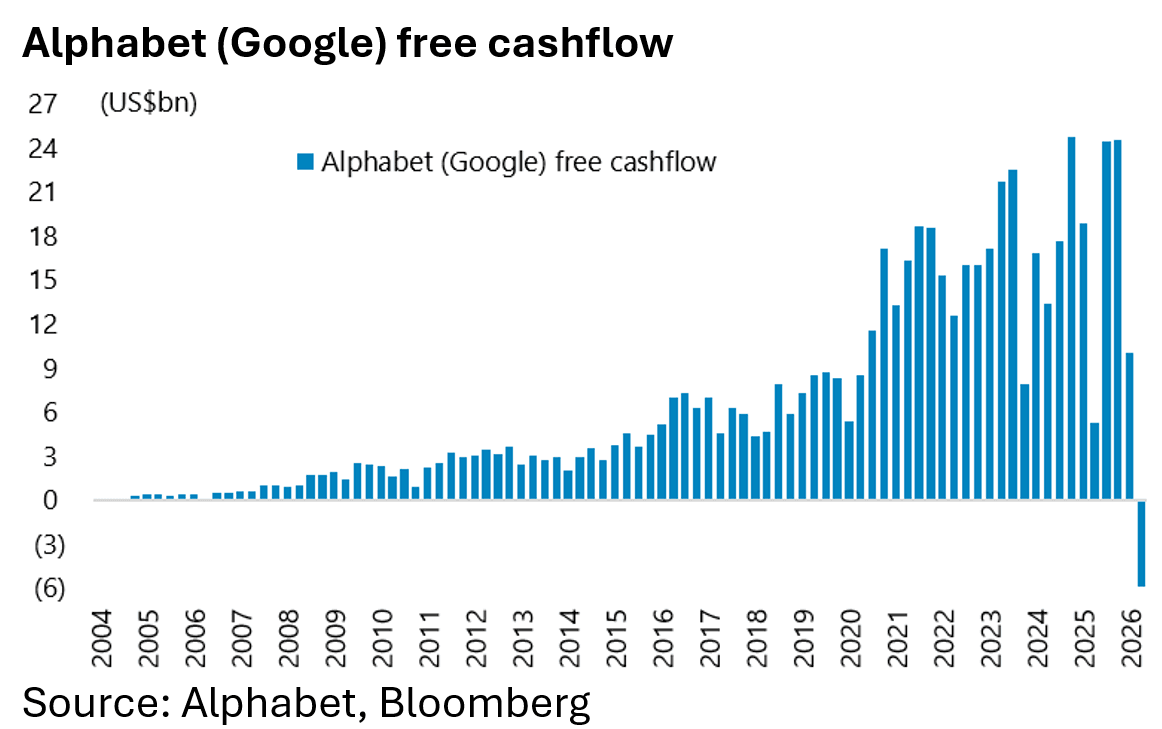
By contrast, in the case of Alphabet, the market chose to focus, at least initially, on the first negative cash flow quarter since its original IPO as Google in August 2004.
Alphabet’s free cash flow declined from US$24.55bn in 4Q25 to a negative US$5.85bn in 2Q26, while Google Gloud revenues surged by 82% YoY to US$24.8bn in 2Q26.
Alphabet also raised its 2026 capex guidance from US$180-190bn to US$195-205bn.
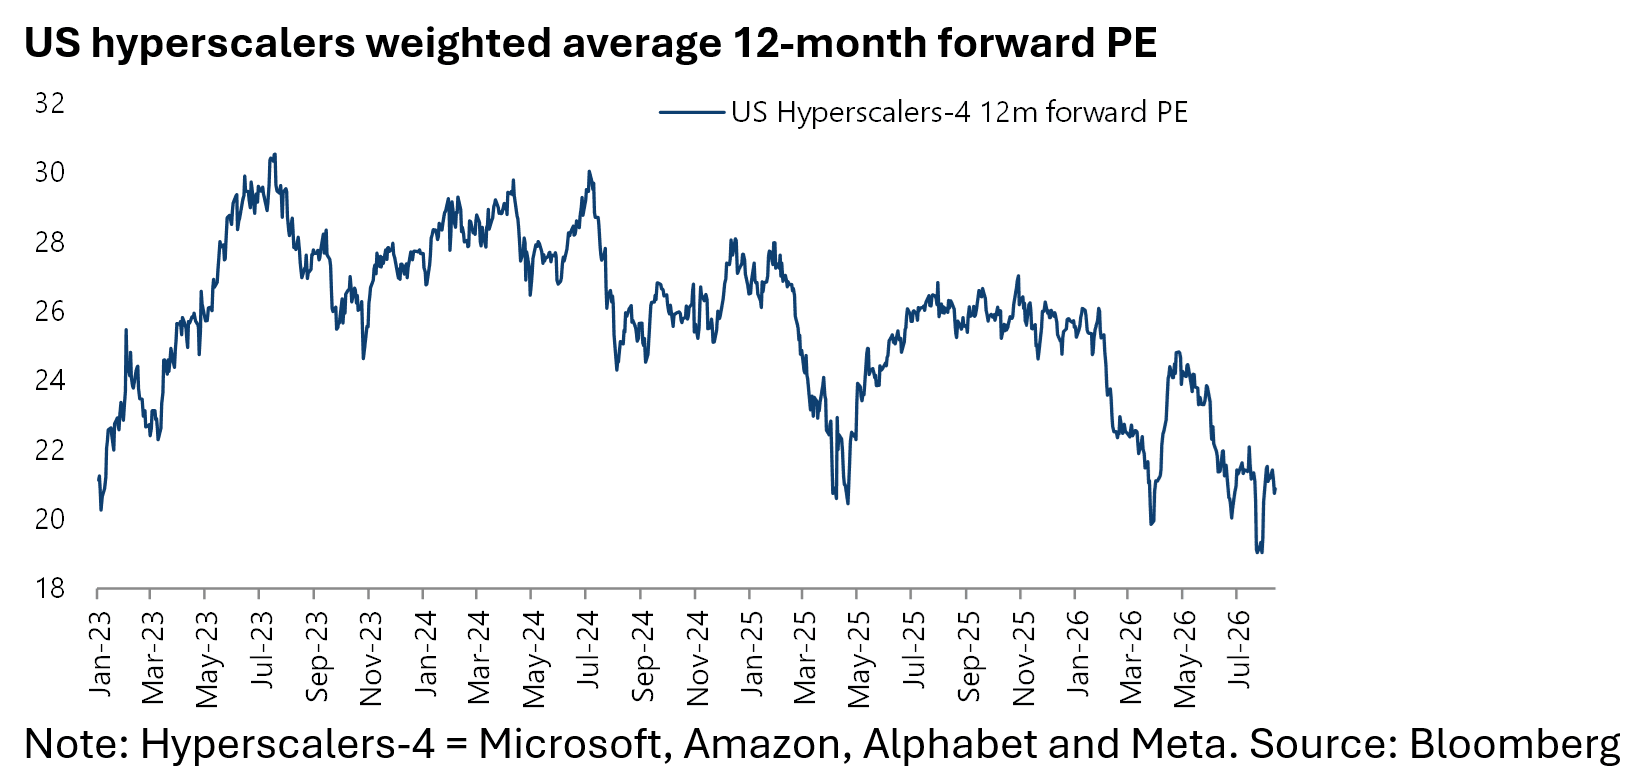
Meanwhile, we attribute the concerns on rising capex and the impact on cash flow as the reason why the hyperscalers have de-rated so far this year as regards valuations.
The four hyperscalers’ weighted average 12-month forward PE declined from 25.5x at the start of this year to 19.0x in late July and is now 20.9x.
Overall US Earnings Growth Remains Strong Thanks to AI Spending
Still the overall US equity market has benefitted from another stellar second quarter earnings season driven primarily, though far from exclusively, by tech hardware where the AI capex story remains highly earnings accretive.
S&P500 2Q26 EPS rose by 41% YoY, the highest post-global financial crisis growth (excl. Covid).
The London Stock Exchange Group (LSEG) I/B/E/S consensus data as of 7 August shows that S&P500 3Q26 earnings are expected to rise by 28.6% YoY, up from 16.1% growth expected last October.
The IT sector has the second highest forecast 3Q26 earnings growth of 61.1%, up from 22.3% last October.
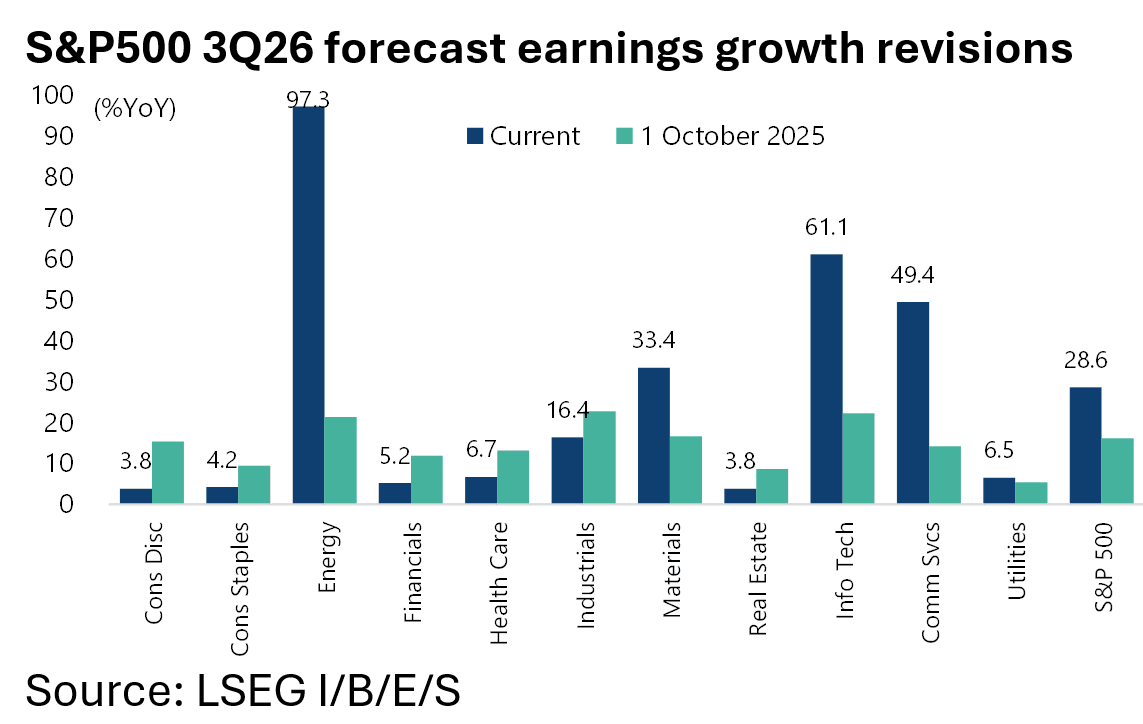
All 12 sub-industries in the IT sector have higher forecast earnings than a year ago, with the semiconductors and semiconductor materials & equipment sub-industries having the highest earnings growth (126.2% and 62.6%, respectively).
If these two sub-industries are excluded, the forecast growth rate for the IT sector declines to 22.3%.
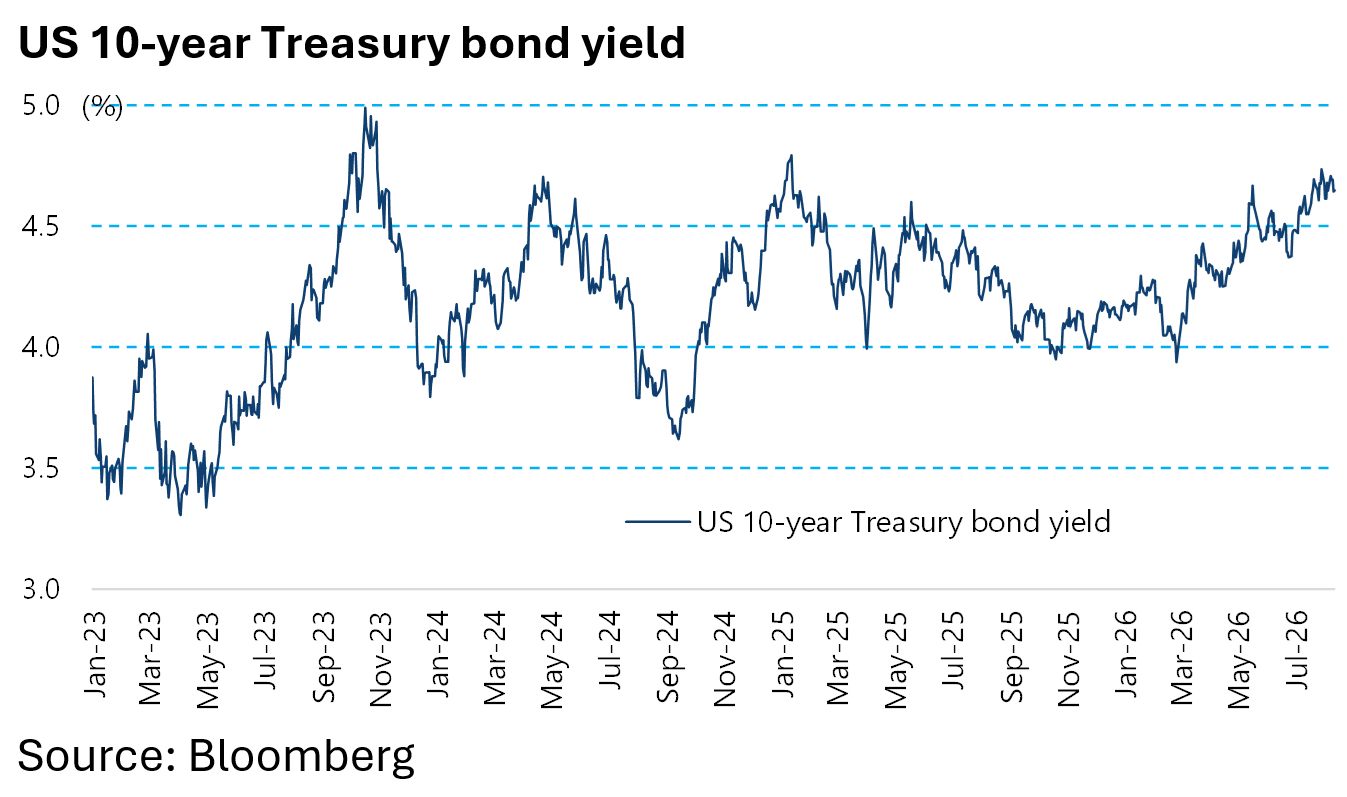
Given this powerful earnings backdrop and yet another U-turn from Donald Trump in terms of a retreat from his most recent threat to renew attacks on Iran, the major risk to equities remains a further rise in Treasury bonds.
But for that to become a real concern 5% on the 10-year Treasury bond yield is the level.
A clear break above 4.5% as happened in recent weeks is more akin to a warning signal, equivalent to a yellow light at a traffic signal. A decisive move above 5% is more akin to a red signal. The 10 year Treasury bond yield is now 4.65%.
The views expressed in Chris Wood’s column on Grizzle reflect Chris Wood’s personal opinion only, and they have not been reviewed or endorsed by Jefferies. The information in the column has not been reviewed or verified by Jefferies. None of Jefferies, its affiliates or employees, directors or officers shall have any liability whatsoever in connection with the content published on this website.
The opinions provided in this article are those of the author and do not constitute investment advice. Readers should assume that the author and/or employees of Grizzle hold positions in the company or companies mentioned in the article. For more information, please see our Content Disclaimer.
About Author