
This writer remains of the view that Treasury bonds are in a structural bear market and that equity investors should hedge their portfolios by betting on a pickup in bond “vol” as discussed here previously (see AI Stock Buyers Beware, 17 December 2025).
This is because a renewed uptick in Treasury bond yields in coming months is one obvious risk to US equities which continue to be driven by the AI capex trade after the sell-off triggered by the Iran War.
Nvidia and the four hyperscalers have risen by 27.2% from the recent low reached in late March, while the S&P500 is up 13.1% over the same period.
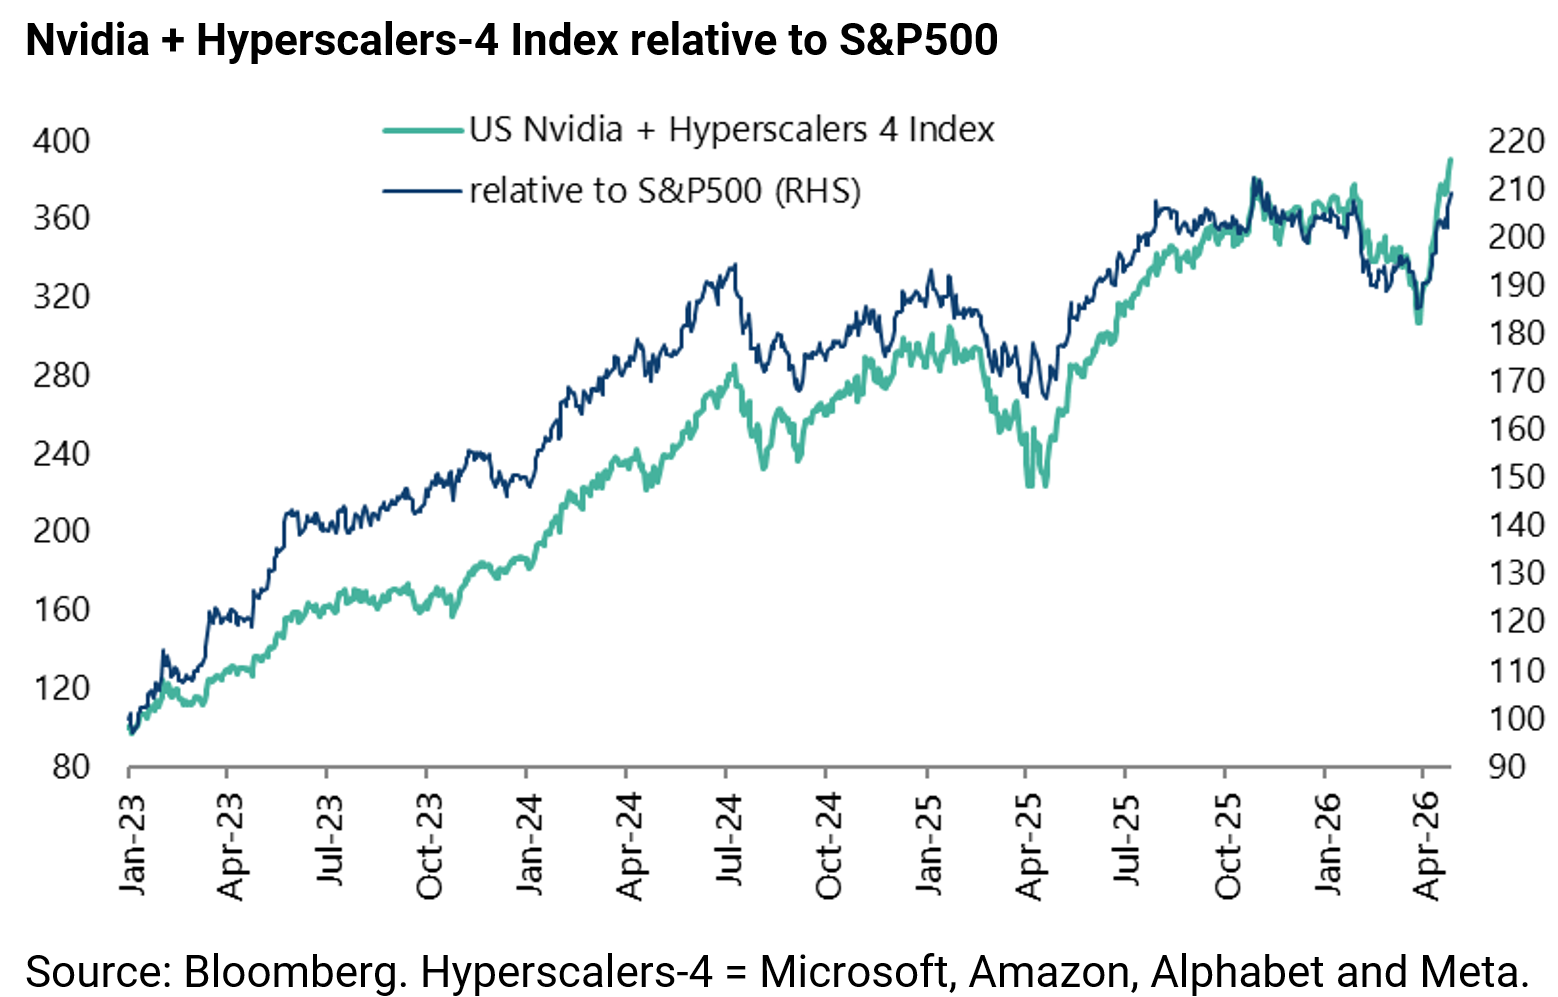
It is also the case that Nvidia and the four hyperscalers still account for an estimated 45% of the gains in the S&P500 since the start of 2023 when the AI capex arms race commenced.
Meanwhile, the market will start to focus on the likely arrival of Fed Chairman appointee Kevin Warsh at the US central bank. Warsh has continued to talk about balance sheet contraction, which is interesting since the Fed decided in December to resume balance sheet expansion again by initiating purchases of shorter-term Treasury securities (mainly Treasury bills) “for the sole purpose of maintaining an ample supply of reserves over time”.
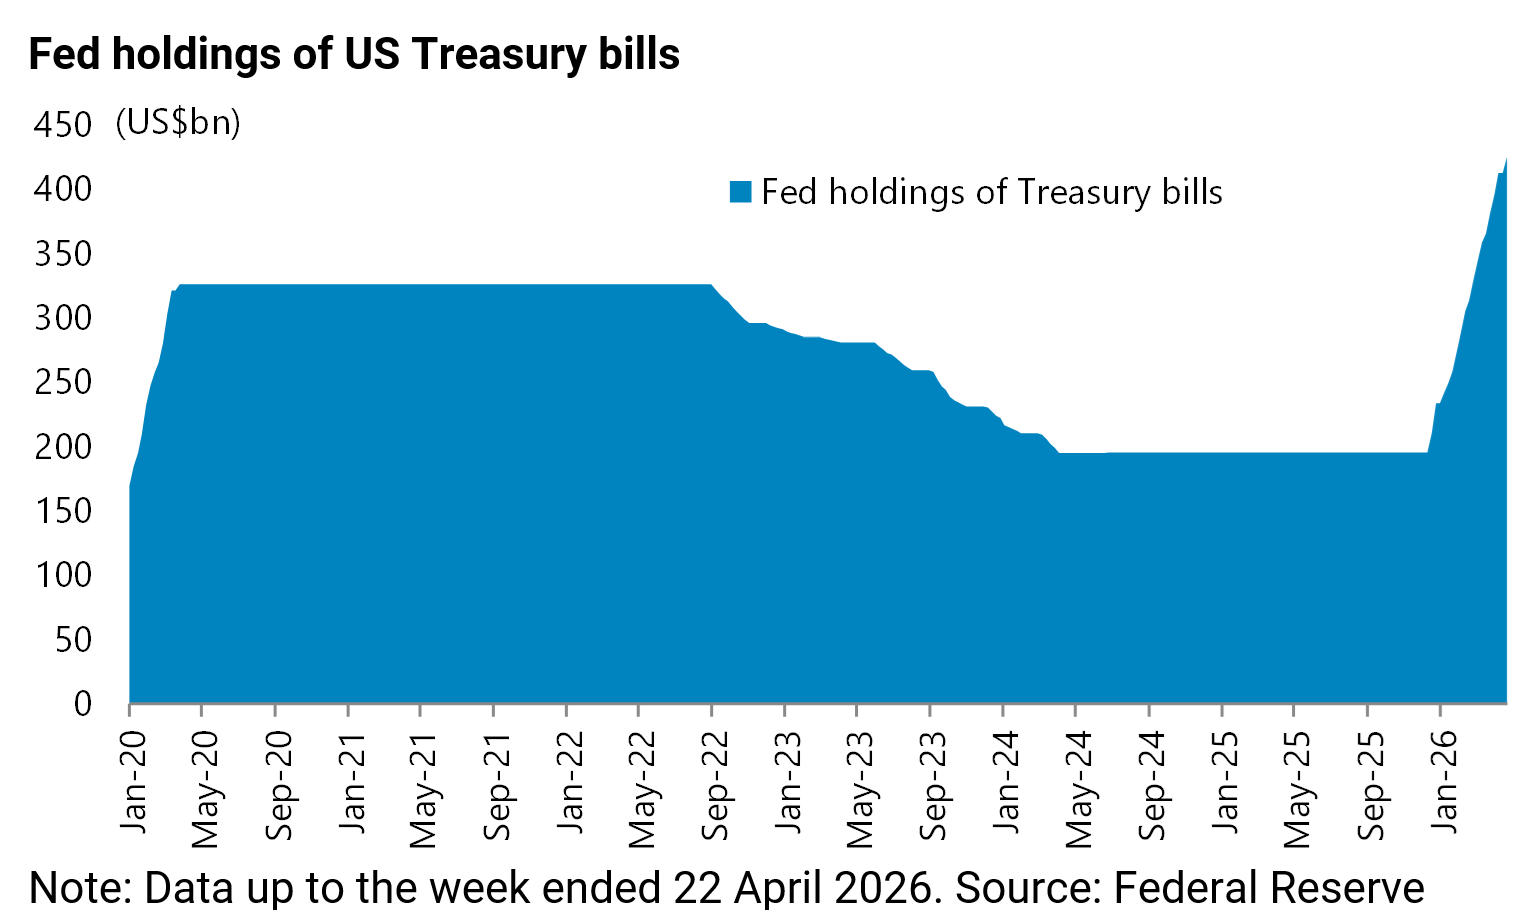
It has since scheduled to purchase US$40bn of Treasury bills per month starting 12 December under the so-called “reserve management purchase” operation, though the pace has reduced to US$25bn in the month beginning 14 April.
This followed signs of emerging liquidity stresses in the repo market last October. In addition to such purchases, the Fed also reinvests all principal payments received from the Fed’s holding of agency securities into Treasury bills.
This amounts to around US$13.4-15.5bn per month. As a result, the Fed’s holdings of Treasury bills have risen by US$229.7bn from US$195.5bn on 10 December to US$425.2bn on 22 April.
The base case remains that Warsh will be quick to back off a balance sheet contraction strategy on any sign of renewed stresses in the repo market.
Meanwhile, as regards the Treasury bond market, it is worth highlighting a report published by Federal Reserve Board staff last October on the Treasury bond “basis trade” (see “FEDS Notes: The Cross-Border Trail of the Treasury Basis Trade” by Daniel Barth, Daniel Beltran, Matthew Hoops, Jay Kahn, Emily Liu, and Maria Perozek, 15 October 2025).
This writer recommends all investors who have not done so, be they equity or fixed income, to read it.
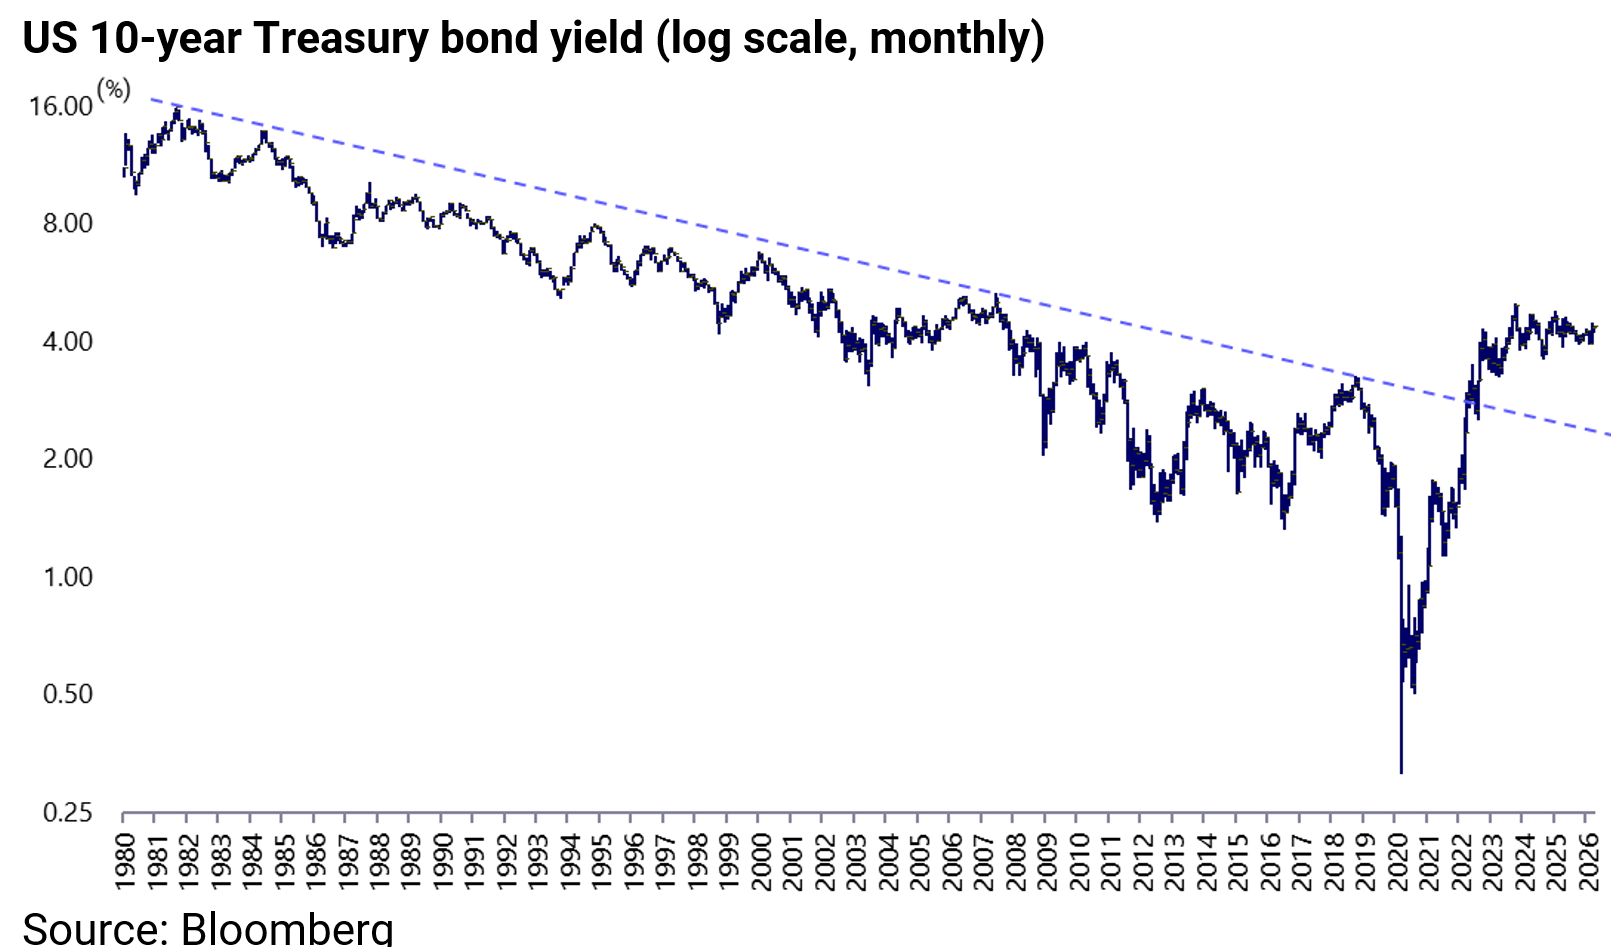
First, it is only 12 pages long. Second, the Treasury bond market is probably the single most important in the world, which is why it remains a big deal that it entered a bear market in March 2020 after a 39-year bull market, as highlighted in the log chart below.
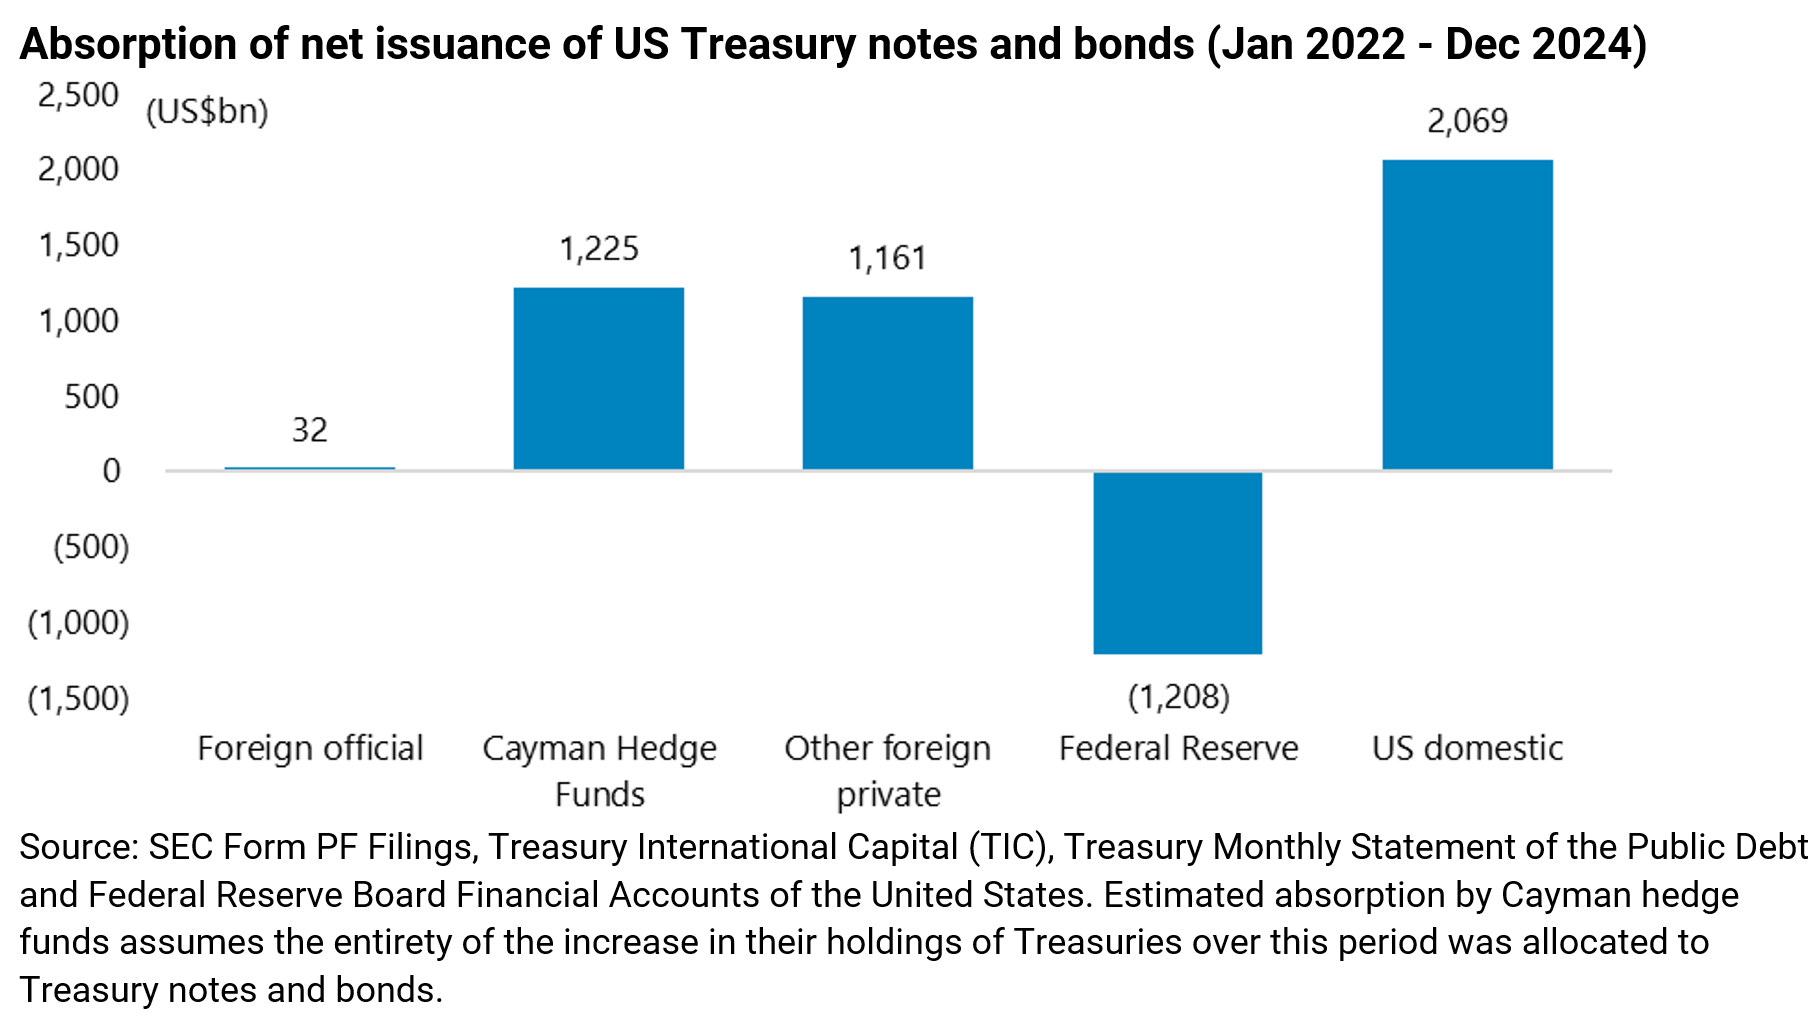
The key conclusion of the six Fed researchers credited with authoring this paper, which is based on data between January 2022 and December 2024, is that Cayman Islands-based hedge funds were increasingly the marginal buyers of Treasury notes and bonds during a period when the Fed was reducing its balance sheet by allowing maturing Treasuries to roll off.
The report estimates that the Cayman-based funds purchased a net US$1.2tn during this period, absorbing 37% of the net issuance of Treasury note and bonds or “nearly the same amount as all of other foreign investors combined” (see following chart).
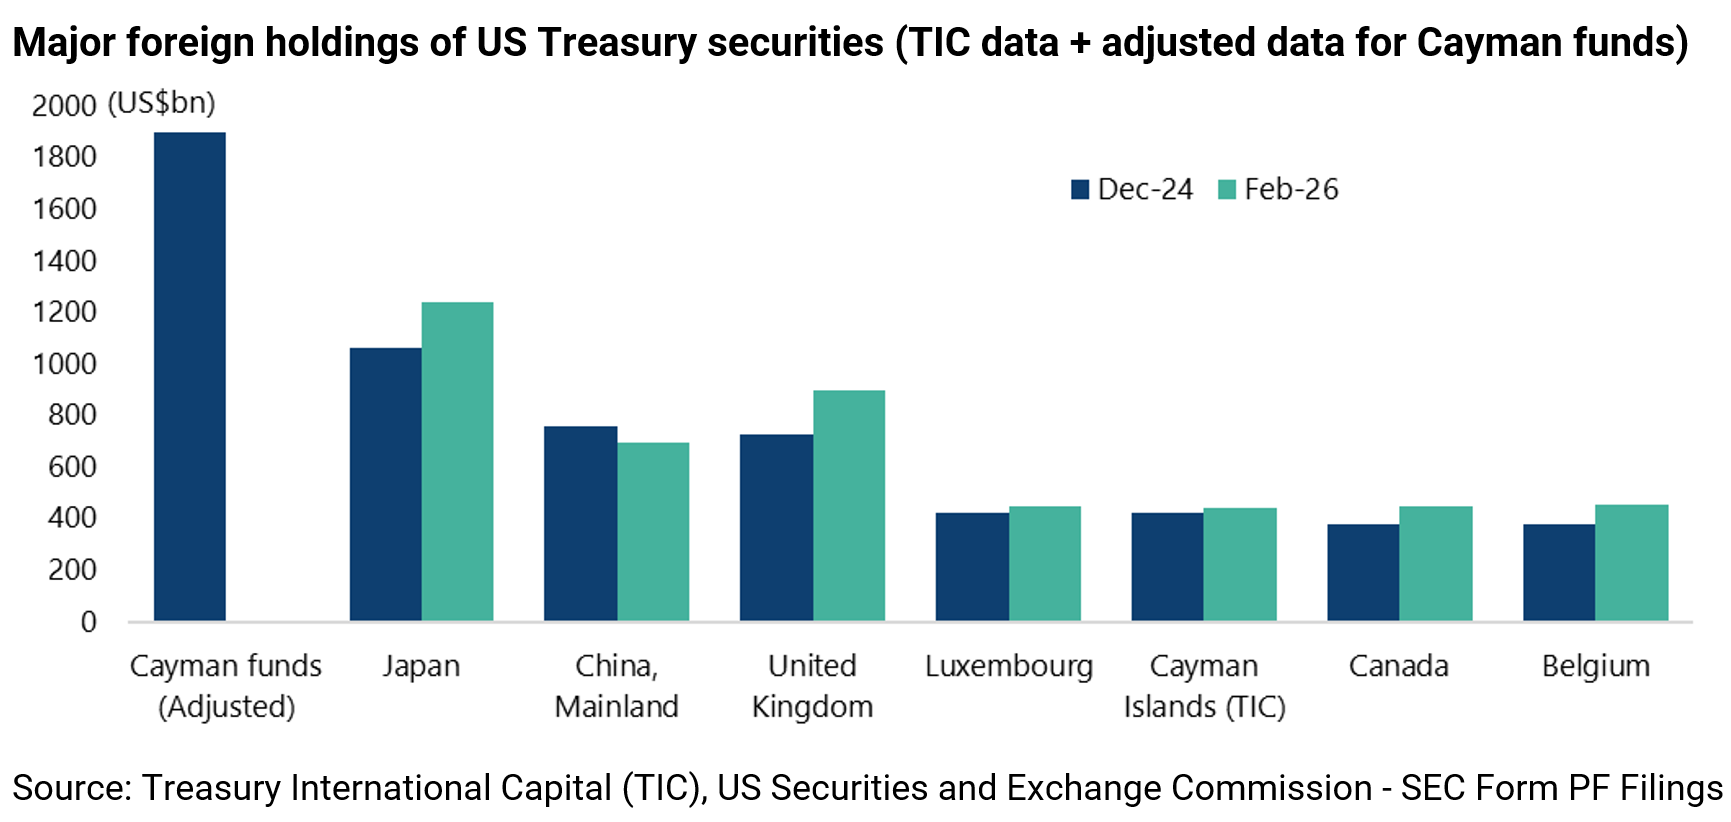
The report also concludes, after adjusting the Cayman-owned Treasuries reported in the widely followed Treasury International Capital (TIC) data released monthly, that Cayman funds are the largest “foreign” holder of US Treasury securities, holding significantly more than China, Japan and the United Kingdom, which were listed as the three largest in the TIC data as at the end of 2024.
Thus, the report estimates that Cayman-domiciled investors held roughly US$1.9tn of Treasury securities at the end of 2024, based on Securities and Exchange Commission (SEC) Form PF filings. This compared with US$1.06tn held by Japan, US$723bn by the UK and US$759bn by mainland China at that time.
The above is, obviously, highly significant in the context of the Treasury’s extreme dependence on short-term funding discussed here previously (see Is Trump’s Focus on Low Yields and Low Volatility Good for Your Wallet?, 4 November 2025) and given the reality that many of the Cayman-based funds are engaged in the highly leveraged basis trade whereby they short Treasury futures and long Treasury securities to arbitrage price differences.
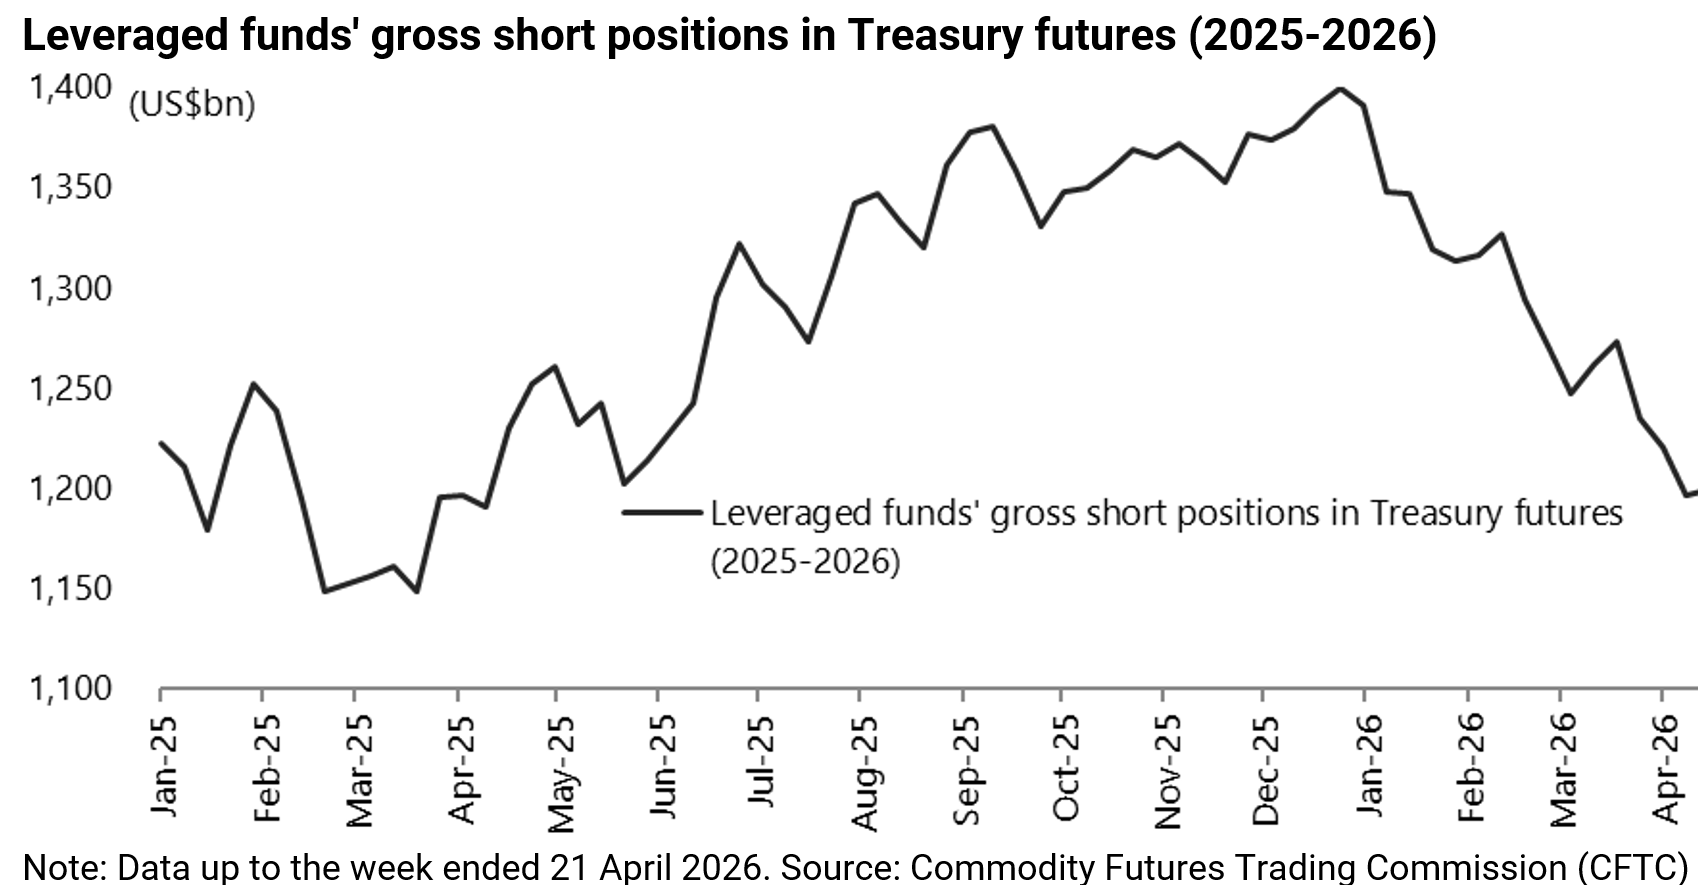
On this point, the increase in leveraged funds’ gross short Treasury positions during this period is shown in the chart below from the report.
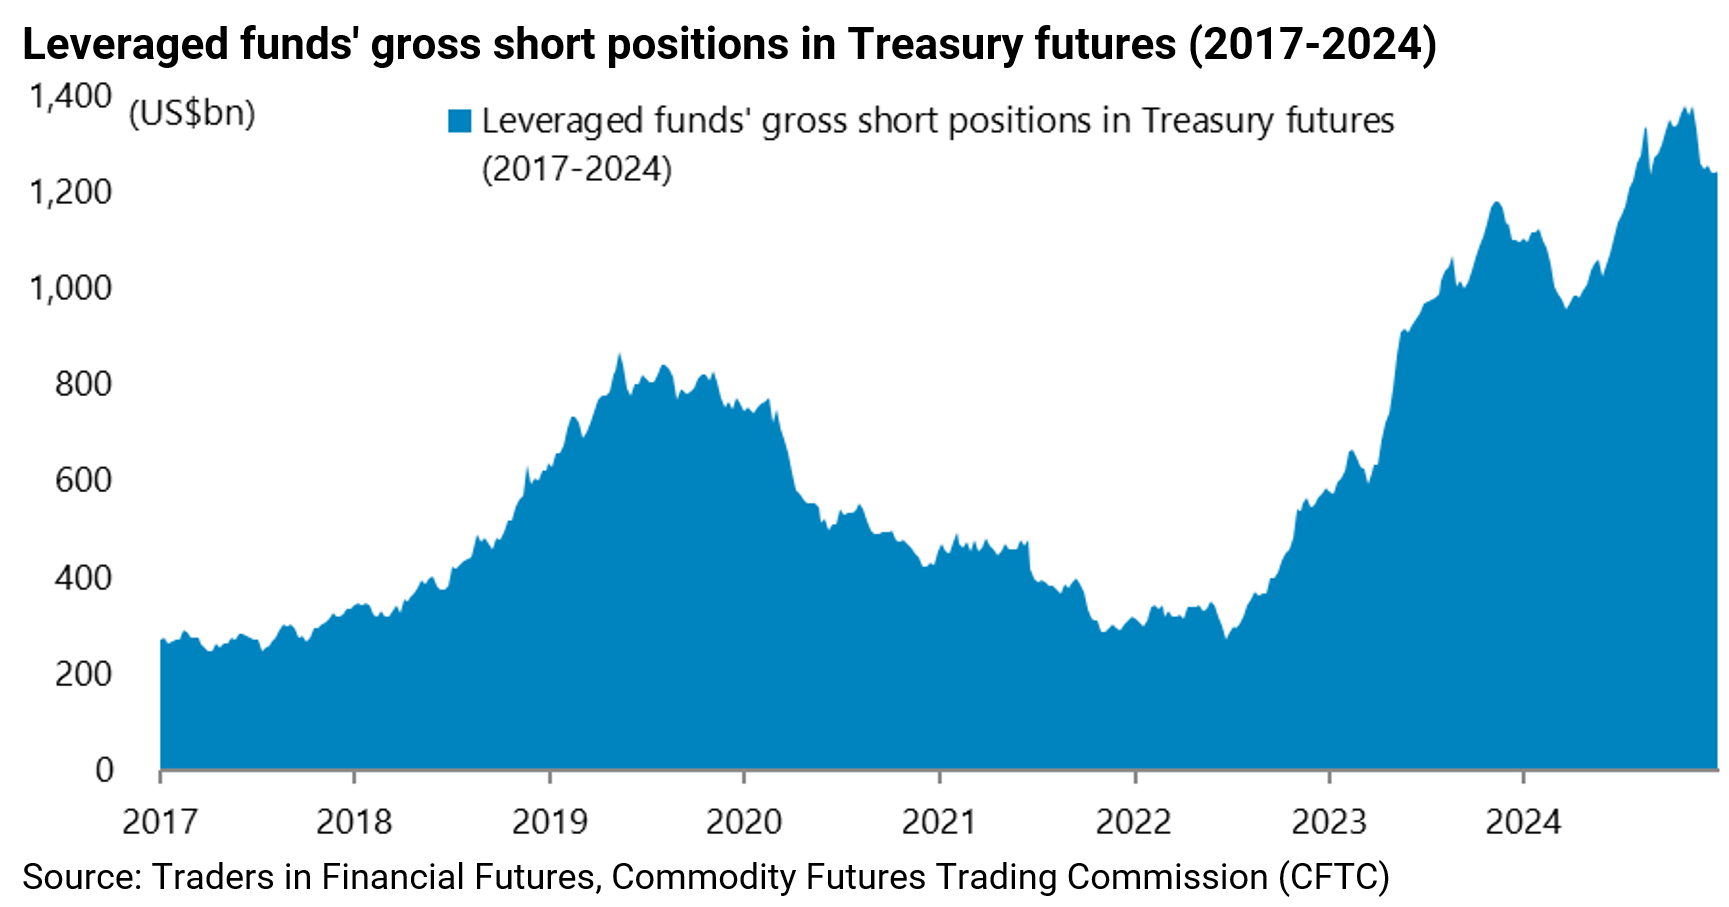
The updated chart of the current positions is also shown below (see following charts).
The Fed report notes that shorting the futures is usually funded through net repo borrowing, which is why any renewed evidence of liquidity stresses in the repo market will be potentially highly relevant.
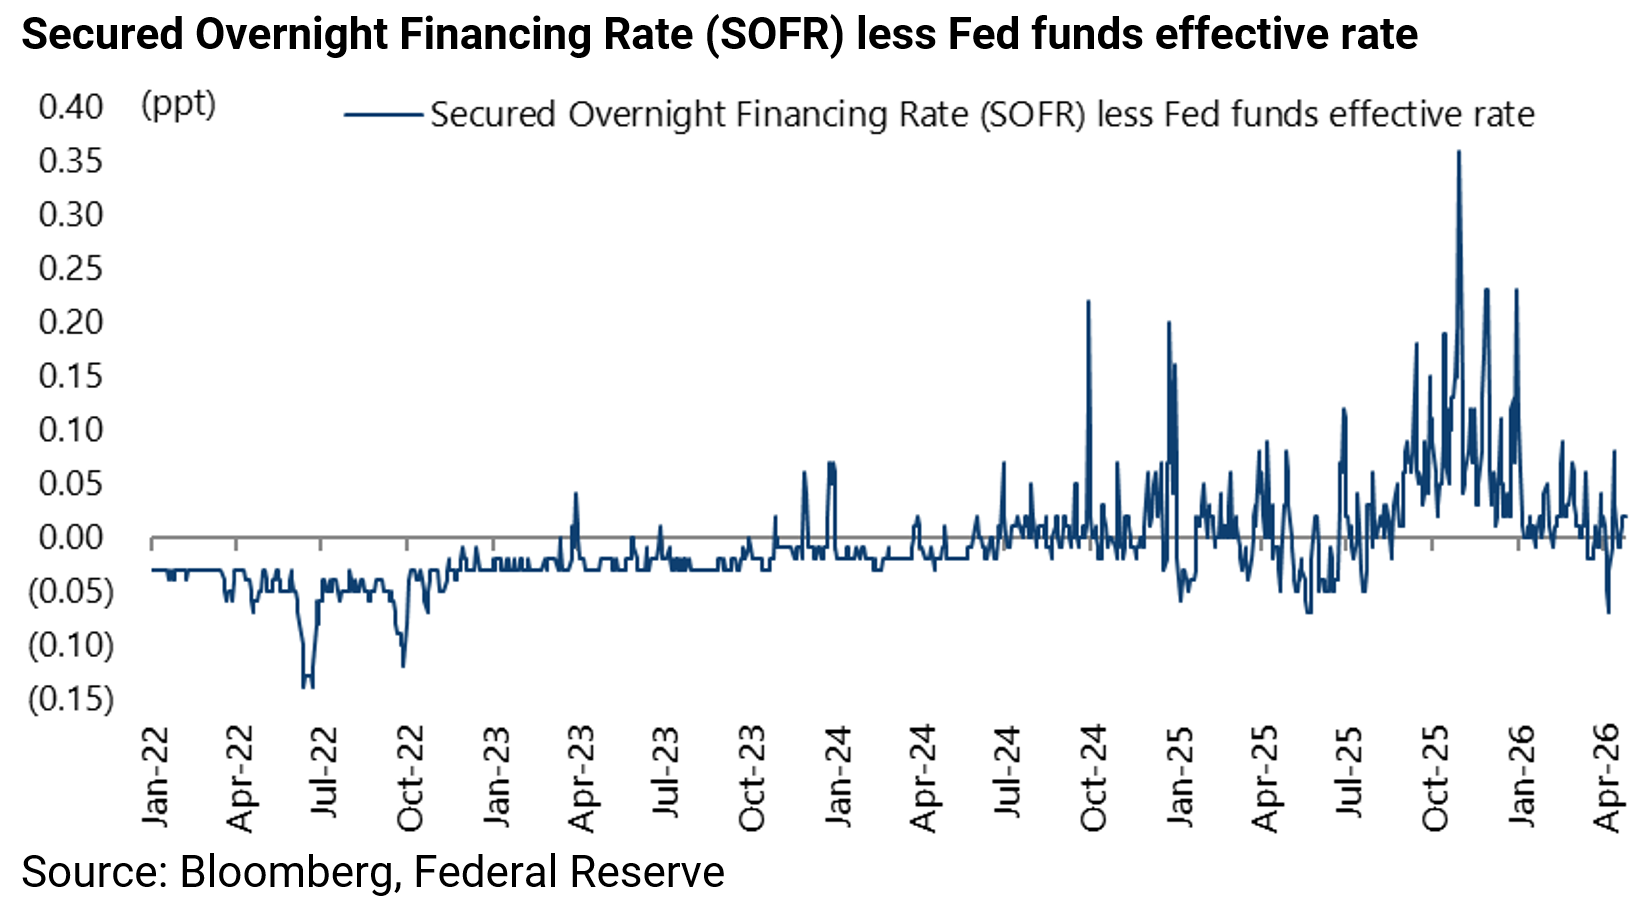
On this point, US banks borrowed a then record US$50.35bn from the Fed’s Standing Repo Facility (SRF) on 31 October and a new high of US$74.6bn on 31 December and a total of US$74.17bn year-to-date.
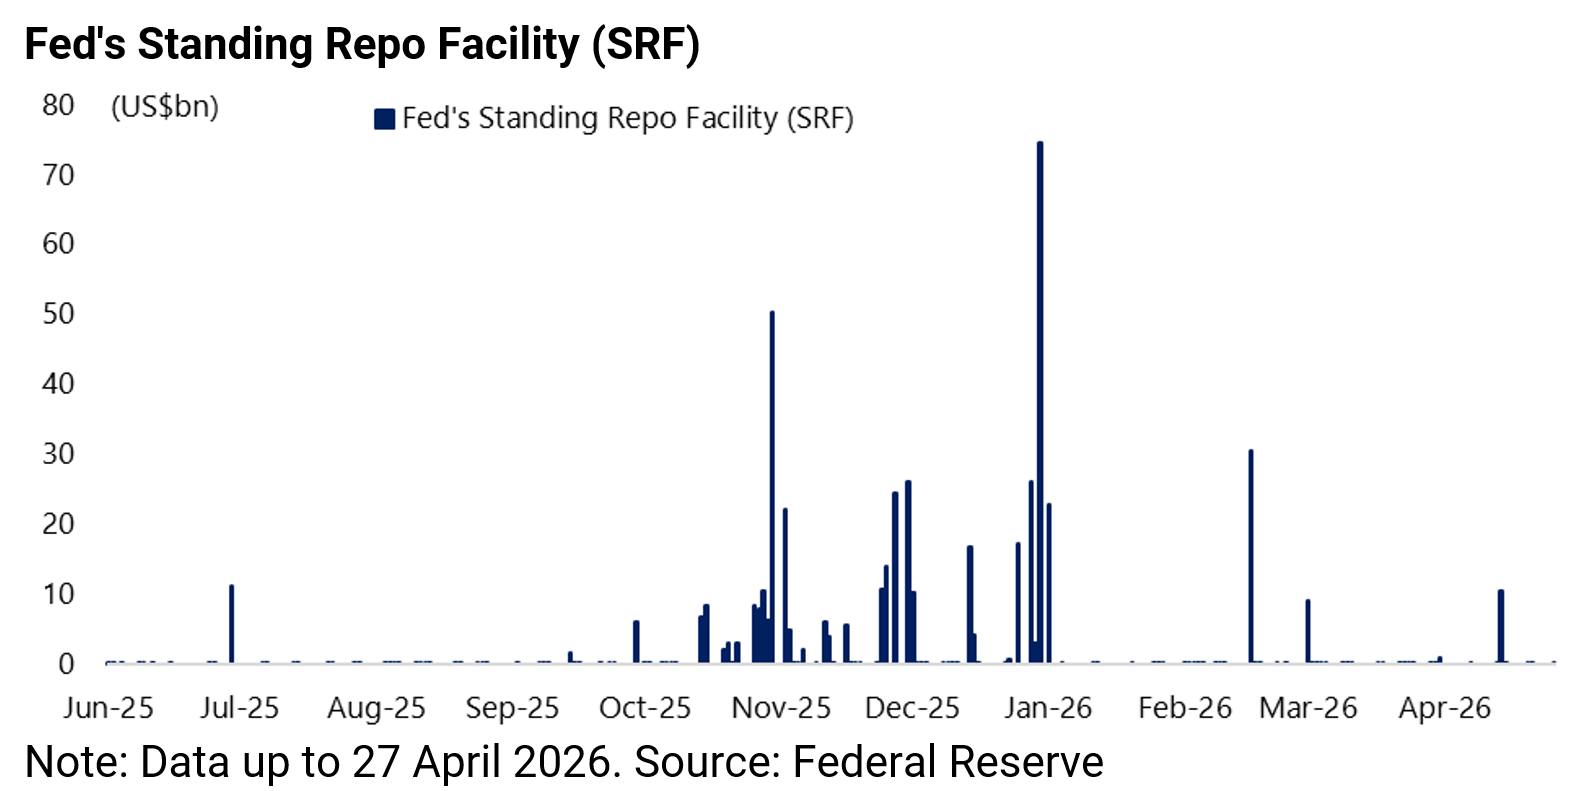
The spread between the secured overnight financing rate (SOFR) and the Fed funds effective rate surged to 36bp at the end of October 2025, the highest level since September 2019, and is now only 2bp.
Meanwhile, it is also worth noting from a more technical perspective that the report concludes that the reason the Cayman Islands’ holdings are understated in the official TIC data is “due to their use as ‘repo collateral’”.
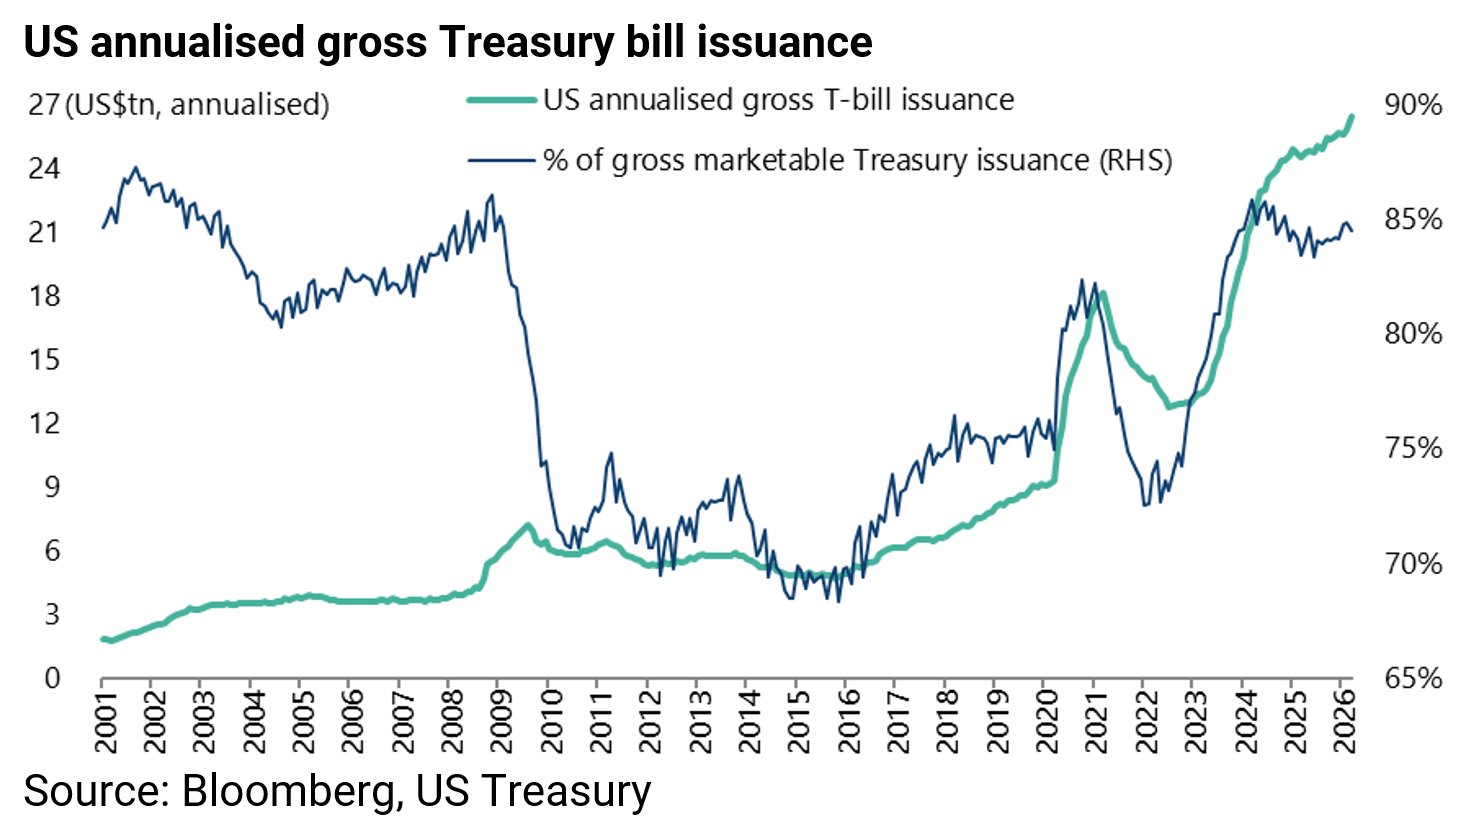
So, the bottom line is that the marginal buyers in recent years of Treasury debt are hedge funds operating on a highly leveraged basis (an estimated about 20x) at a time when the federal government’s borrowing has become increasingly short term.
Gross Treasury bill issuance totaled a record US$26.47trn in the 12 months to March, accounting for 84.5% of total Treasury issuance of US$31.32tn over the same period.
This is why any renewed volatility in the Treasury bond market, in terms of upward pressure on yields, is likely to lead to more formal policies of yield suppression, which would be positive for gold and negative for the US dollar.
The conclusion for investors is as obvious as it is simple. And the best stories in investment are always simple.
That is that investors are not paid to take the risk of owning long-term Treasury bonds.
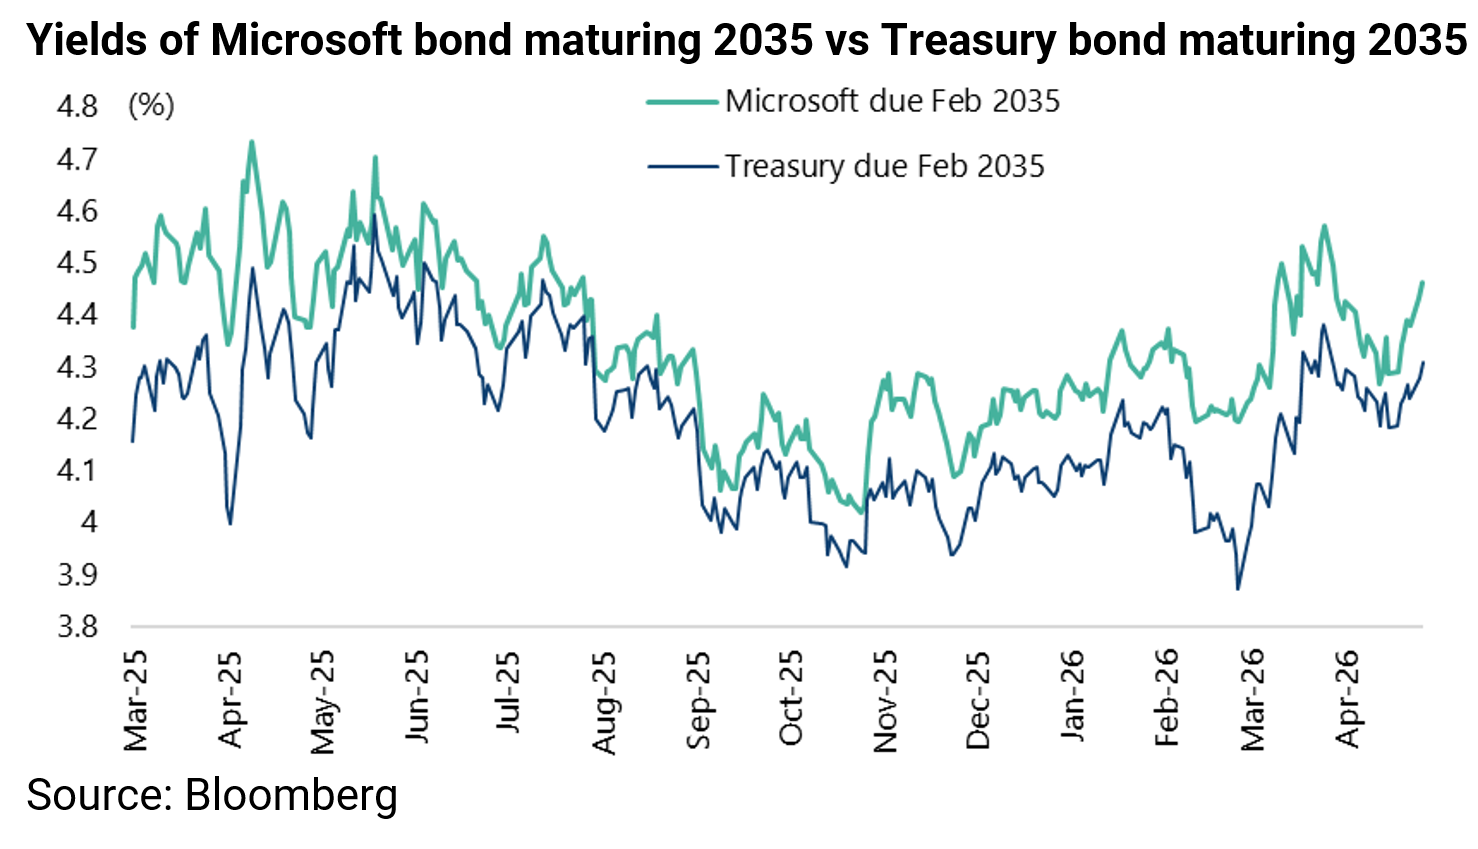
For investors who want to own long-term US dollar-denominated debt, the highest quality investment-grade corporate bonds continue to be preferred since they have far superior balance sheets. Indeed, in a government bond market panic such bonds have the potential to trade below Treasuries in yield terms.
On this point, the Microsoft bond maturing 2035 with a 3.5% coupon now yields 4.46% or only 15bp above the yield of the US Treasury bond maturing 2035, after narrowing to 6bp in mid-April and 4bp last July.
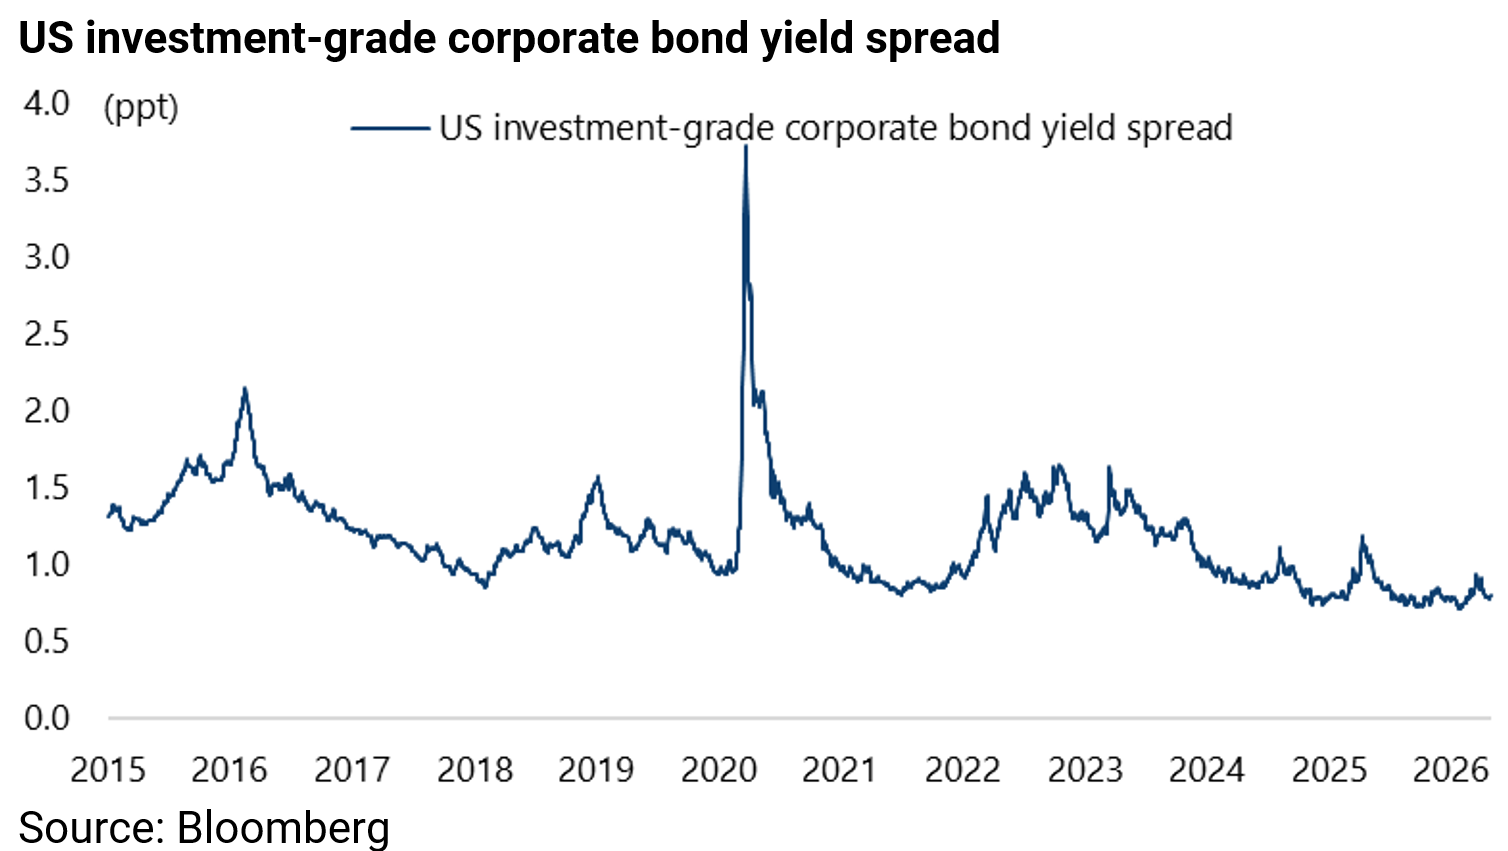
While the average US investment-grade corporate bond yield spread over Treasuries has declined from 119bp in April 2025 to 71bp in late January, the lowest level since mid-1998, and is now 80bp.
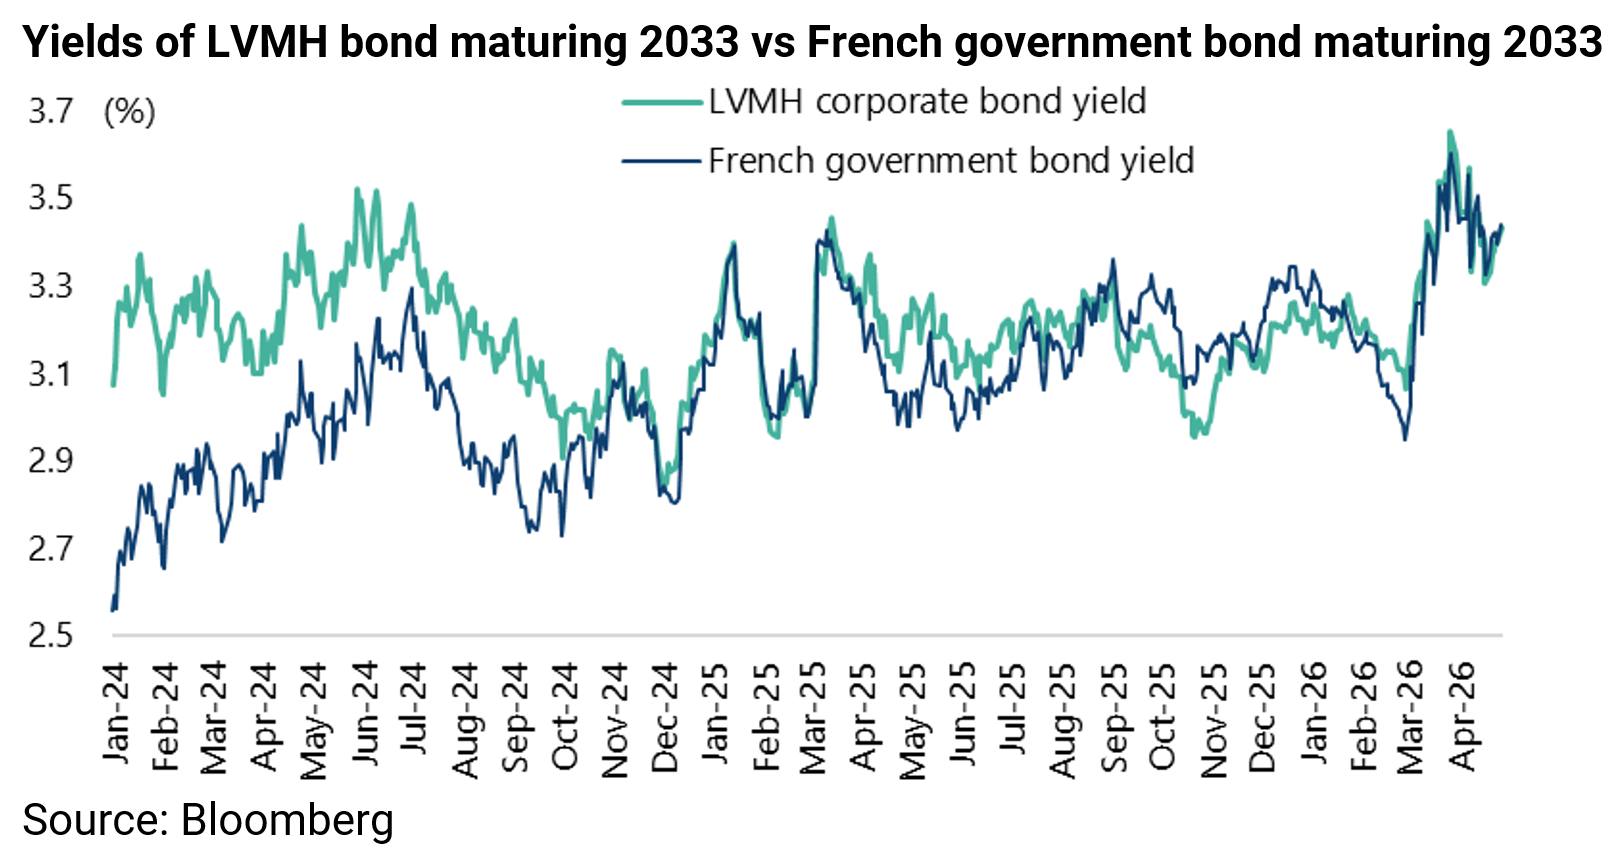
Indeed, such a trade through government bond yields has already happened in fiscally challenged France, with borrowing costs for some French companies falling below French government bond yields of a similar maturity.
For example, the LVMH bond maturing 2033 with a 3.5% coupon now yields 3.43% or 1bp below the yield of the French government bond maturing 2033. It yielded 2.96% in late October or 19bp below the French government bond.
Still, from a US equity standpoint, the risk-on mood is not threatened so long as the 10-year Treasury does not break above 4.5% in yield terms since the market can continue to focus on earnings upgrades driven primarily by the AI capex cycle.
The LSEG I/B/E/S consensus data as of 24 April shows that S&P500 1Q26 earnings are expected to rise by 16.1% YoY, up from 10.9% growth expected last July.
The IT sector now has the highest forecast 1Q26 earnings growth of 48.2%, up from 20.7% last July.
Thus, the IT sector is expected to earn US$184.7bn in 1Q26, up from US$124.7bn in 1Q25, with all 12 sub-industries in the sector having higher earnings than a year ago.
Unsurprisingly, the semiconductors and electronic components sub-industries have the highest earning growth (109.2% and 43.4%, respectively).
If these two sub-industries are excluded, the forecast growth rate for the IT sector declines to 21.3%.
The above data highlights the importance of the tech hardware sector in driving overall earnings.
Indeed, earnings for the tech sector account for 30% of the I/B/E/S forecast 1Q26 earnings for the S&P500, up from 24% in 1Q25.
It is this tech-centred earnings story which is the main explanation for the US stock market’s resilience of late, combined with the assumption of most investors that Donald Trump is looking for a way out of Iran.
The views expressed in Chris Wood’s column on Grizzle reflect Chris Wood’s personal opinion only, and they have not been reviewed or endorsed by Jefferies. The information in the column has not been reviewed or verified by Jefferies. None of Jefferies, its affiliates or employees, directors or officers shall have any liability whatsoever in connection with the content published on this website.
The opinions provided in this article are those of the author and do not constitute investment advice. Readers should assume that the author and/or employees of Grizzle hold positions in the company or companies mentioned in the article. For more information, please see our Content Disclaimer.