
The obvious source of relief for Wall Street-correlated world stock markets, save for a Fed U-turn, would be a sign that inflation has peaked and is coming down sharply. This is clearly not yet the case.
True, US CPI eased off a bit in July helped by the recent correction in the oil-led commodity complex.
But the details of the report hardly suggest a collapse in prices is underway.
Headline CPI inflation slowed from 9.1% YoY in June to 8.5% YoY, while core CPI inflation remained unchanged at 5.9% YoY.
US CPI inflation
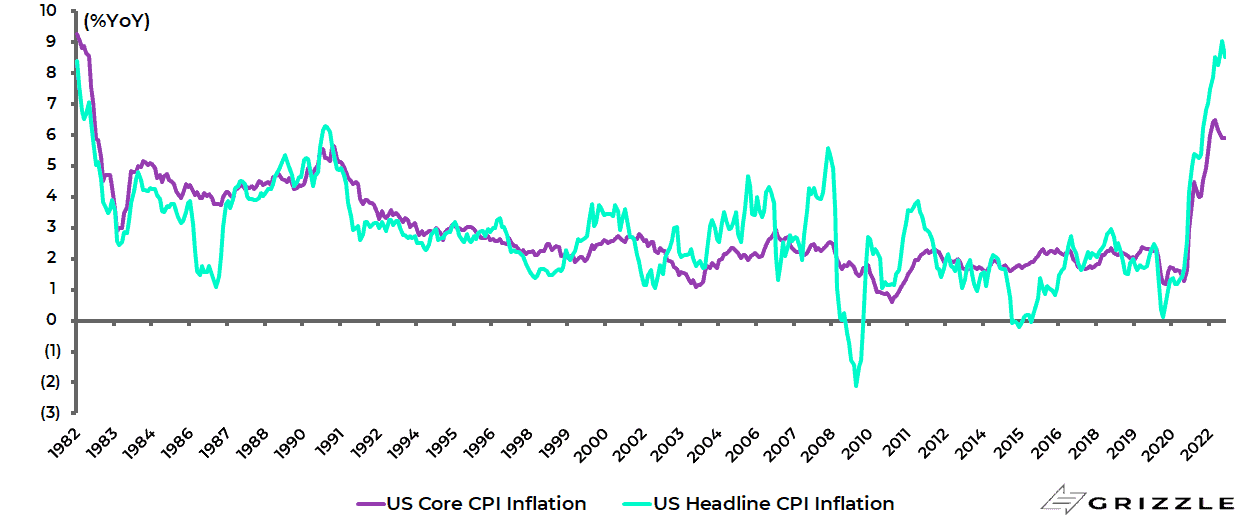
On a month-on-month basis headline CPI slowed from 1.3% MoM in June to 0.0% MoM in July, while core CPI slowed from 0.7% to 0.3%.
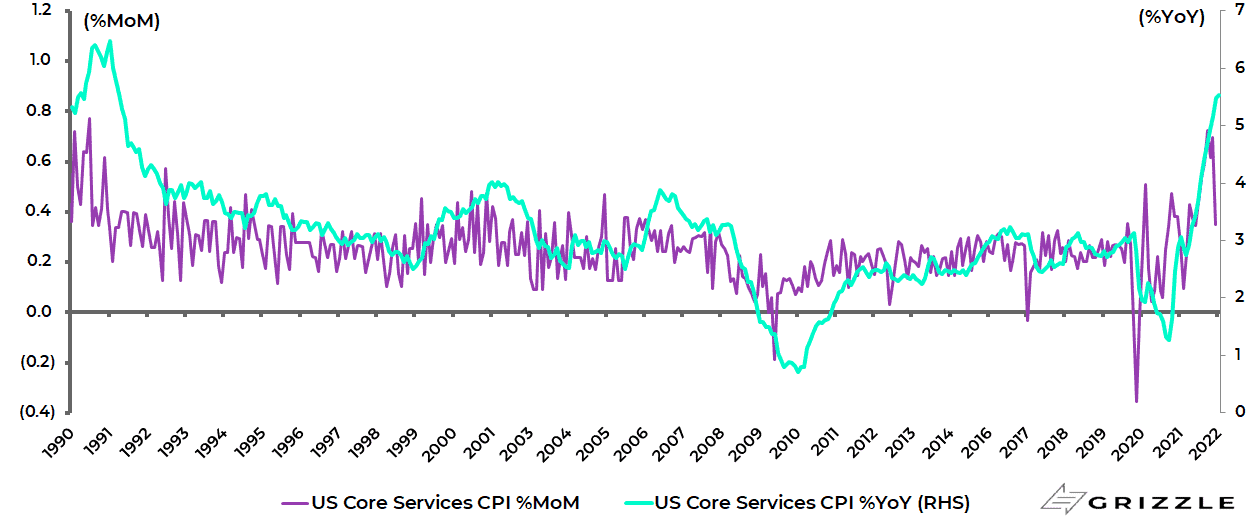
Core goods inflation slowed from 0.8% MoM in June to 0.2% in July and core services inflation from 0.7% MoM to 0.4% though, it should be noted, on a year-on-year basis core services inflation remains at a 31-year high of 5.5% YoY.
US core services inflation
It is also the case that 18 of the 36 main CPI categories still saw an acceleration in the year-on-year inflation rate.
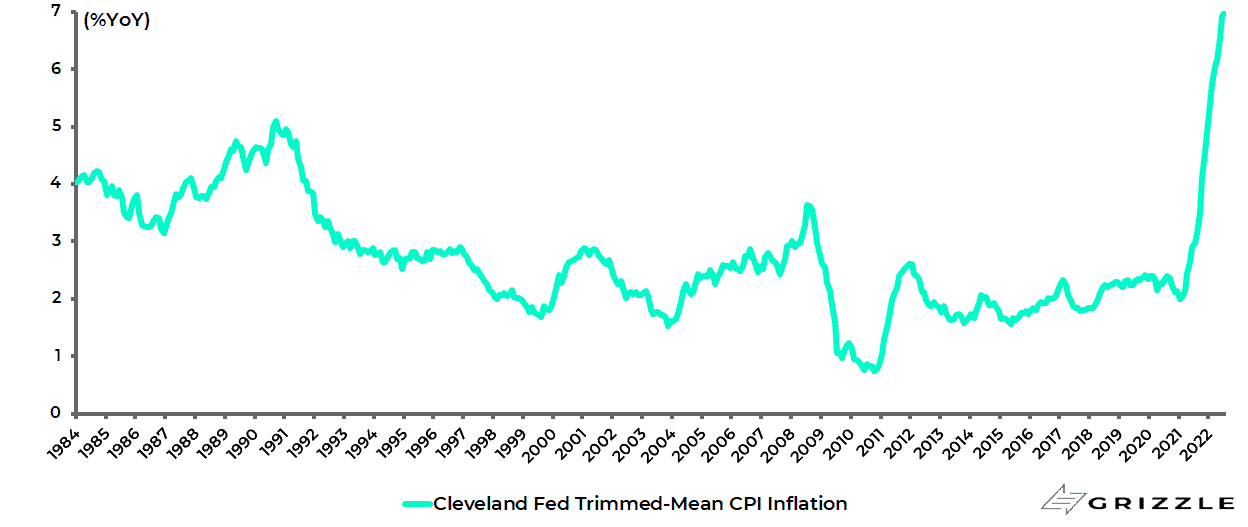
Meanwhile, the Cleveland Fed’s trimmed-mean inflation rose marginally from 6.93% in June to 6.99% in July, the highest level since the data series began in December 1983.
Cleveland Fed Trimmed-mean CPI inflation
All of the above is why markets continue to be faced with the inverse of Goldilocks, and why the monthly US CPI report remains the most important data point monthly for financial markets.
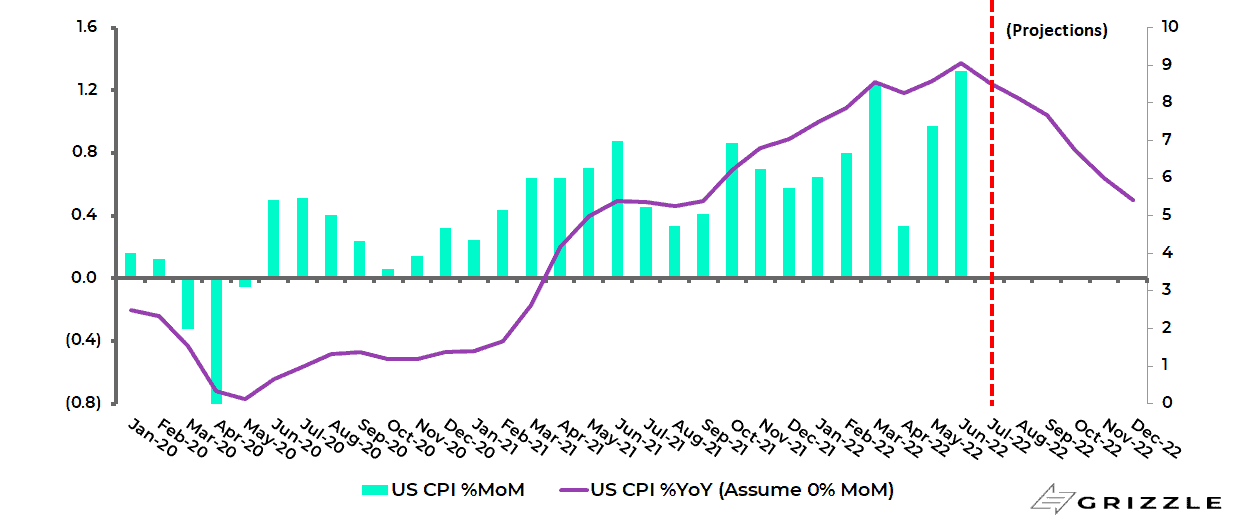
Unfortunately, the prospects are not reassuring since, in addition to the point about the lagged impact of previous monetary expansion, the statistical base effect is also not promising since US month-on-month CPI inflation slowed quite sharply in the third quarter of last year.
The CPI month-on-month change slowed from 0.9% in June 2021 to 0.3% in August 2021 and averaged 0.4% in 3Q21.
US CPI inflation projections assuming 0.0%MoM going forward
Labor Tightness is Not Doing Inflation Any Favors
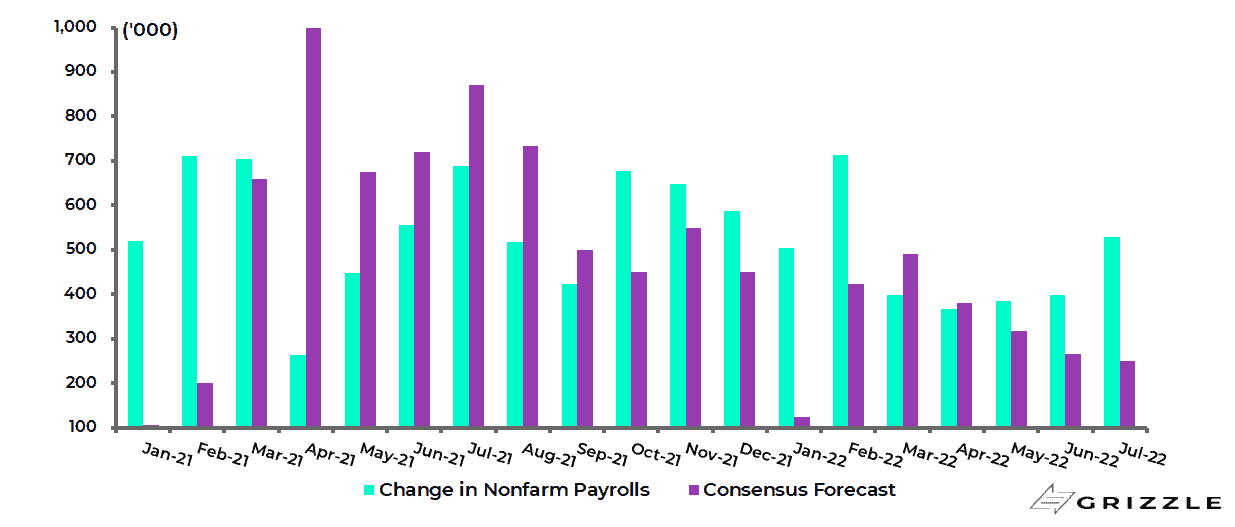
It is also the case that the latest payroll data did not show the extent of labour market weakness that those looking for a change in Fed language are hoping for.
US nonfarm payrolls increased by 528,000 in July, up from 398,000 in June and consensus estimates of 250,000.
US monthly change in nonfarm payrolls
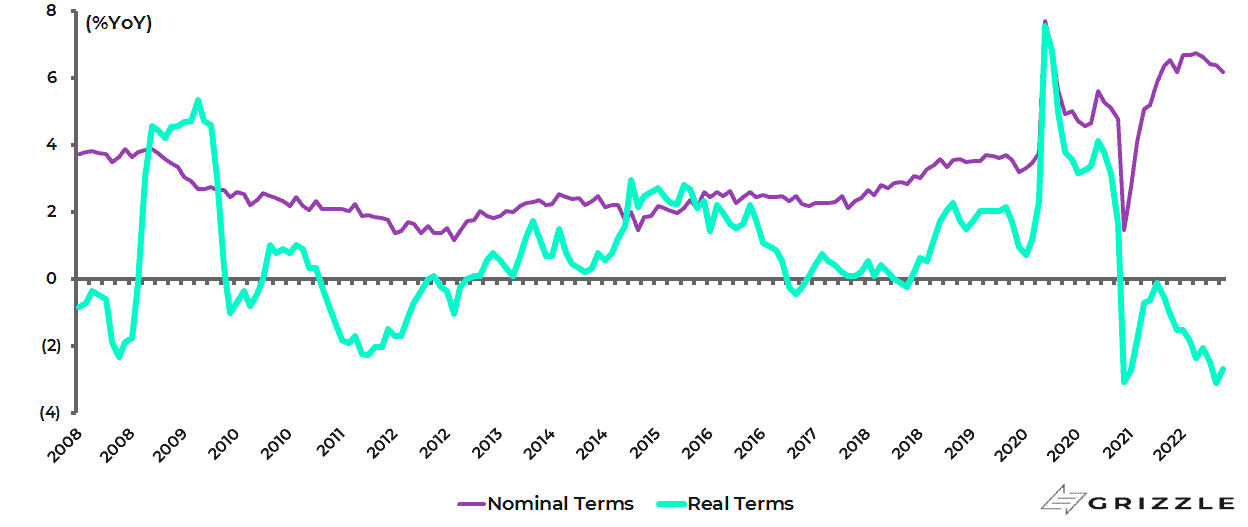
Meanwhile, wage growth continues to hold up though, given the trend in prices, it continues to look much better in nominal terms than in real terms.
Thus, average hourly earnings for private production and nonsupervisory workers rose by 6.2% YoY in July in nominal terms but was down 2.7% YoY in real terms.
US average hourly earnings growth for private production and nonsupervisory workers
Bank Lending is a CounterBalance to Fed Tightening
It is also the case that, while reducing the Fed balance sheet via quantitative tightening will reduce the Fed’s contribution to broad money supply, the commercial banking system has the theoretical ability to increase massively its contribution to broad money supply, via increased lending leading to a resulting pickup in velocity.
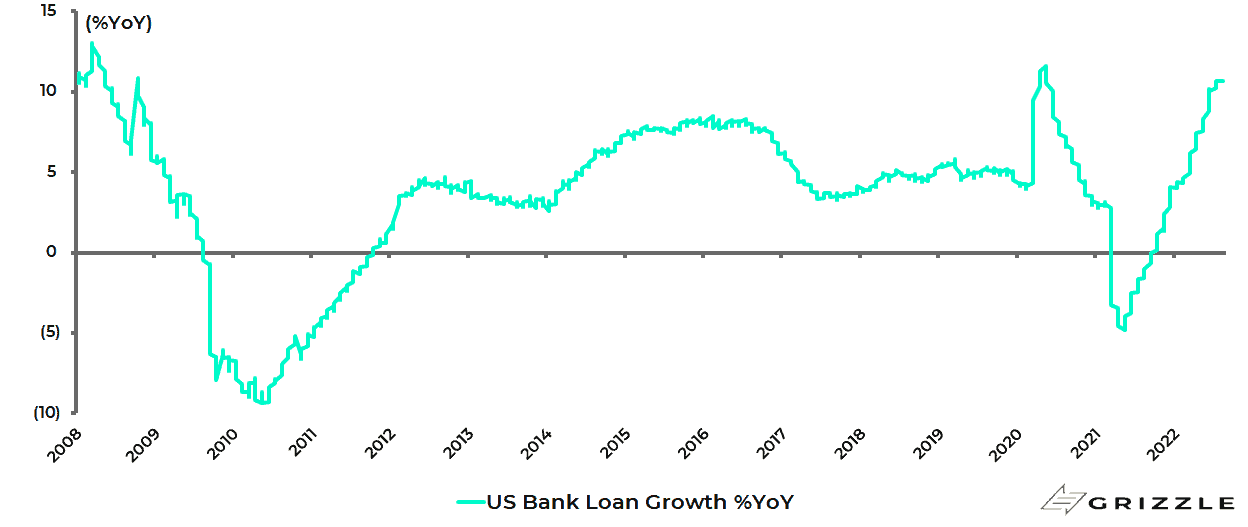
This is why it is important to be aware of the continuing pickup in US commercial bank lending, however counter-intuitive this might be in the face of growing evidence of a slowing economy.
Thus, total bank loans rose by 10.7% YoY in the week ended 3 August and are up 14.9% on a 13-week annualised basis.
US total bank loan growth
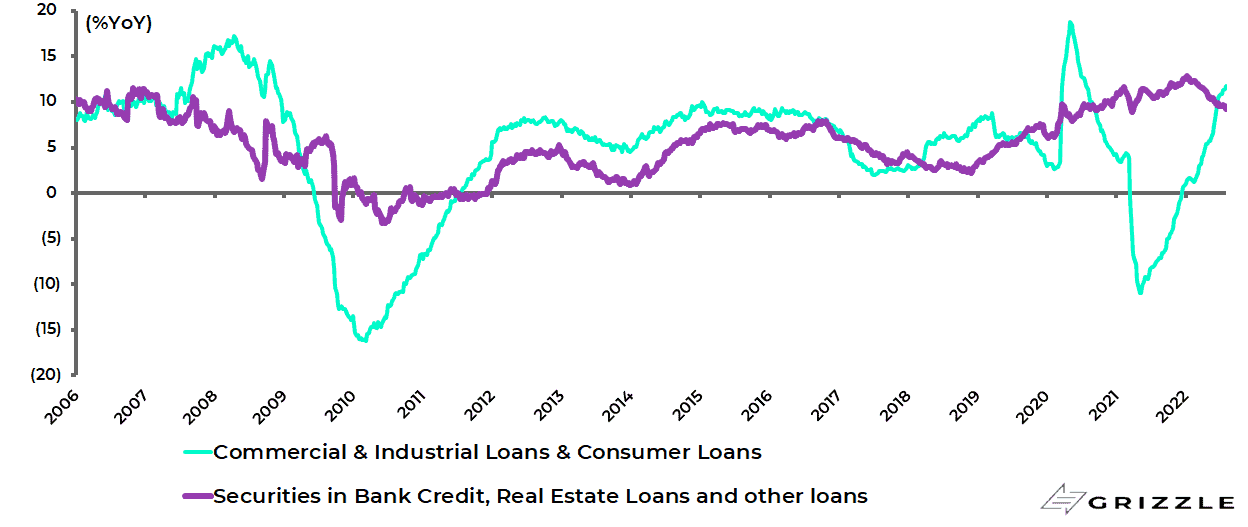
It is also the case that bank lending to the real economy continues to grow at a more rapid rate than lending to finance asset purchases which was the key driver of credit growth during the quantitative easing era.
US commercial & industrial loans and consumer loans, a measure for loans to the real economy, rose by 11.8% YoY in the week ended 3 August, the highest growth rate since July 2020.
While US banks’ securities holdings, real estate loans and other loans and leases, which could be construed as credit to finance asset purchases, were up 9.2% YoY, down from 12.8% YoY in January.
US bank lending for the real economy and bank credit to finance asset purchases
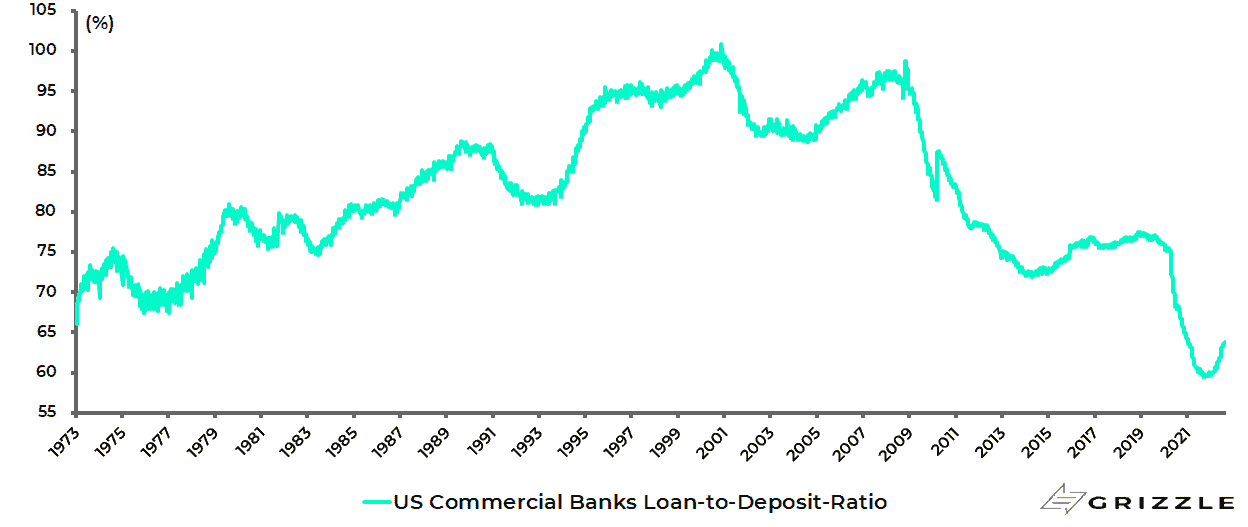
The loan-to-deposit ratio of the US commercial banking system also appears to have bottomed out and banks’ reserves, formerly known as excess reserves held at the Fed, are declining.
The loan-to-deposit ratio has risen from a low of 59.5% in November 2021 to 63.8% in the week ended 3 August, the highest level since January 2021.
US commercial banks’ loan-to-deposit ratio
While US bank reserves have declined by 22% or US$928bn from the peak level of US$4.28tn reached in December 2021 to US$3.35tn in the week ended 10 August.
US bank reserves
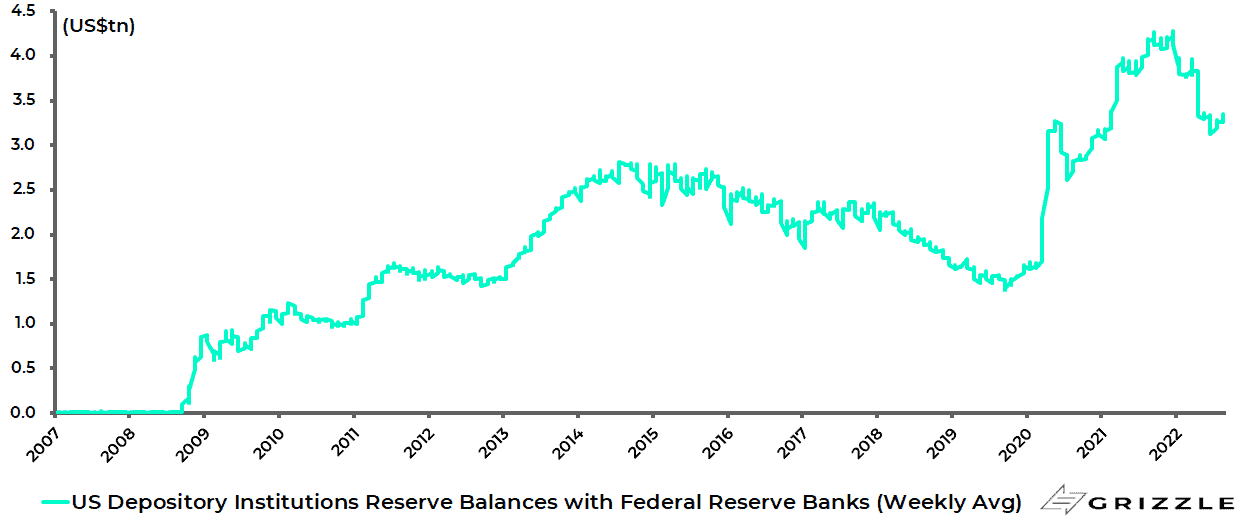
It should be noted that the banks currently earn 2.4% on these reserves or an annualised US$80bn.
Can Banks Pick up the Slack from Flatlining Money Supply?
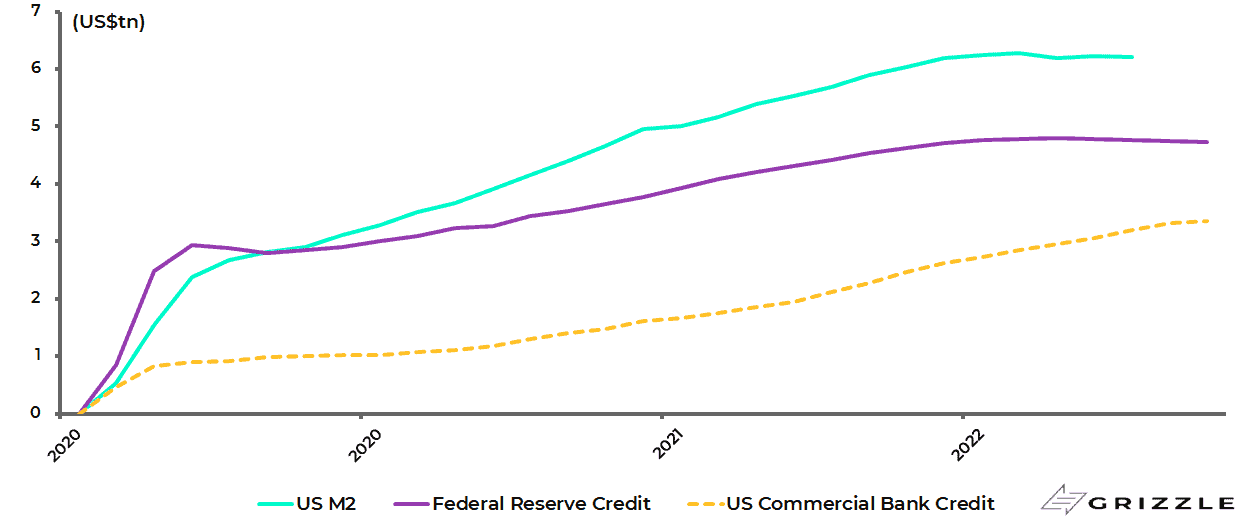
Meanwhile, it is interesting to highlight the contribution to M2 growth from the Fed balance sheet expansion since the implementation of the MMT-lite policy response in March 2020 compared with that of the commercial banking system.
US M2 has increased by US$6.2tn or 40% (annualised 15.6%) from US$15.5tn in February 2020 prior to the pandemic to US$21.7tn in June 2022.
Federal Reserve credit is up US$4.8tn over the same period, compared with a US$3.2tn increase in commercial bank credit.
Increase in US M2, Federal Reserve credit and bank credit since February 2020
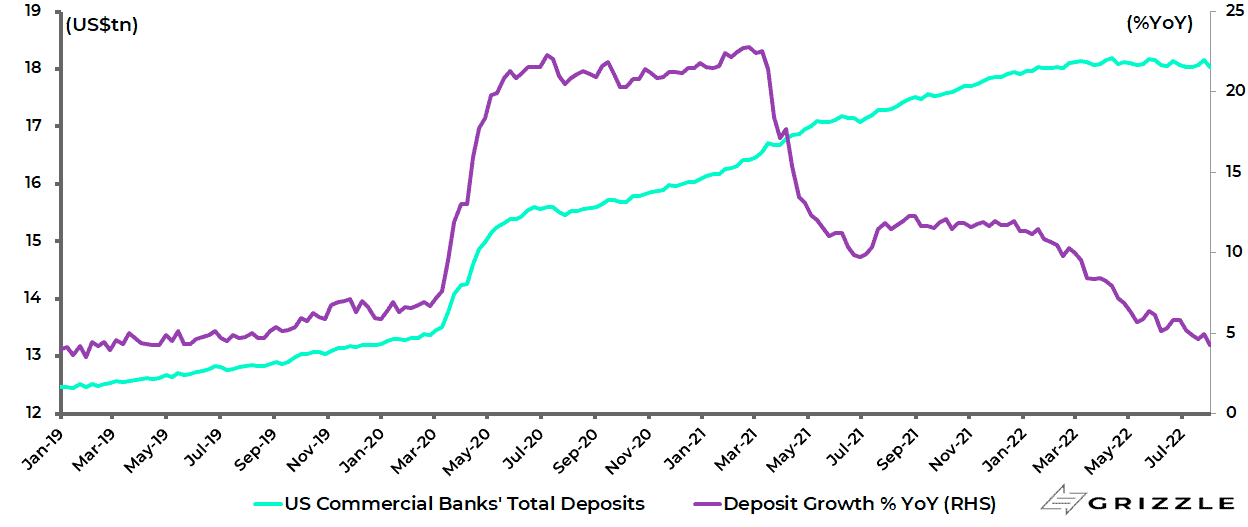
On this point, US commercial banks’ total deposits have been broadly flat since the Fed balance sheet contraction began at the beginning of June, with deposit growth slowing from 11.5% YoY in mid-January to 4.3% YoY in early August.
US commercial banks’ total deposits and deposit growth
What is clear for now is the M2 growth has begun to contract sharply as noted in the attached article by old friends of this writer (see The Wall Street Journal article: “The Fed Ignored the Money Supply, and a Recession Is Coming” by John Greenwood and Steve H. Hanke, 8 July 2022).
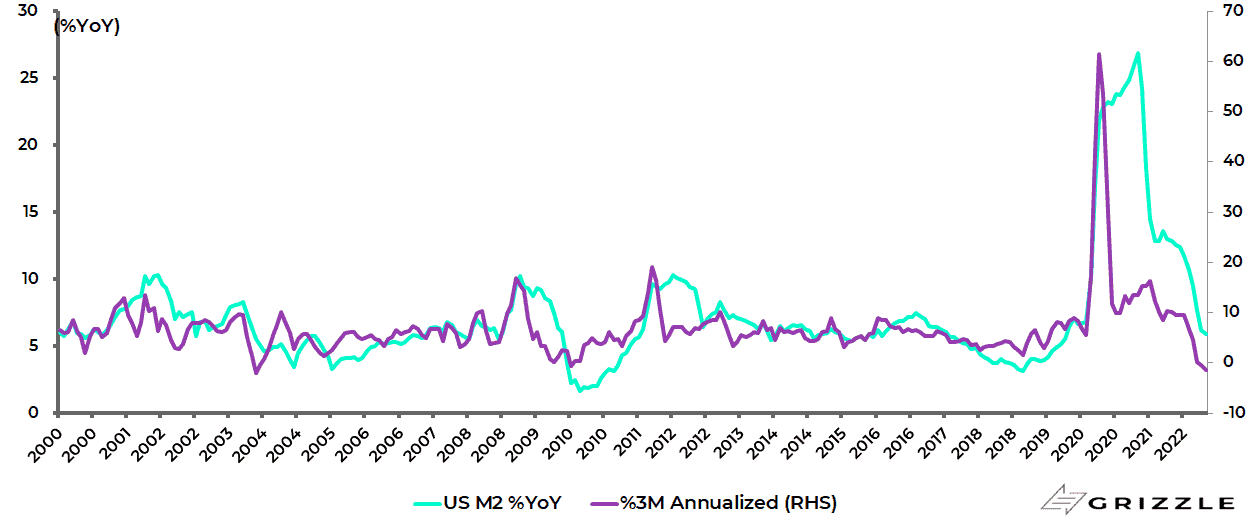
Thus, US M2 growth slowed to 5.9% YoY in June.
Indeed US M2 declined by an annualised 1.3% in the three months to June, the biggest annualised decline since November 2003.
US M2 growth
This sharp decline in money supply growth has potentially alarming implications for the American economy going into 2023, unless the banking system comes to the rescue.
But the lag effects of the previous monetary explosion means that inflation can remain high for a while longer even if the Fed sticks to its current hawkish line for longer than many expect.
The above-referenced article puts those lag effects as lasting for 12-24 months.
The views expressed in Chris Wood’s column on Grizzle reflect Chris Wood’s personal opinion only, and they have not been reviewed or endorsed by Jefferies. The information in the column has not been reviewed or verified by Jefferies. None of Jefferies, its affiliates or employees, directors or officers shall have any liability whatsoever in connection with the content published on this website.
The opinions provided in this article are those of the author and do not constitute investment advice. Readers should assume that the author and/or employees of Grizzle hold positions in the company or companies mentioned in the article. For more information, please see our Content Disclaimer.