

The most important economic data to monitor in Asia this year will be Chinese credit data. On this point, the data for March has confirmed the moderate uptrend in place.
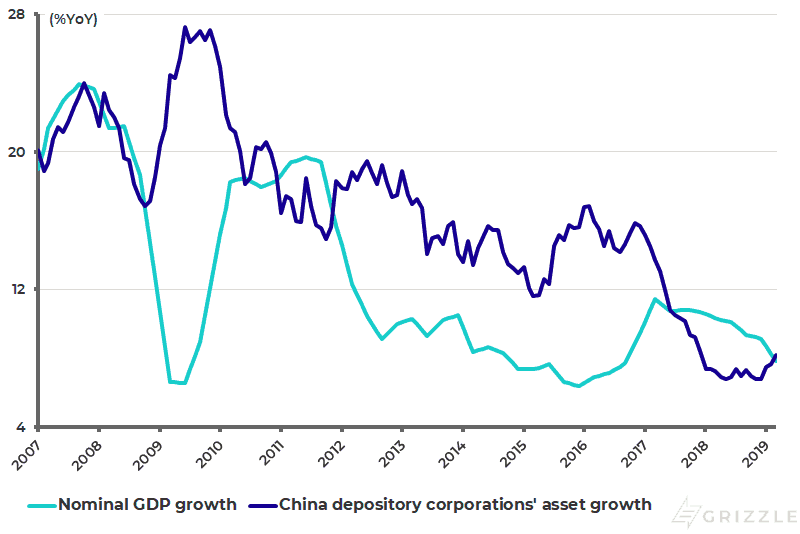
Most importantly, deposit-taking banks’ asset growth rose from 7.7% YoY in February to 8.2% in March (see following chart). This is the highest YoY growth rate since December 2017 and compares with the low of 6.8% reached in December last year. With the latest macro data showing nominal GDP growth falling from 9.1% YoY in 4Q18 to 7.8% in 1Q09, this is the first time since June 2017 when depository corporations’ asset growth has exceeded nominal GDP growth.
China depository corporations’ asset growth and nominal GDP growth
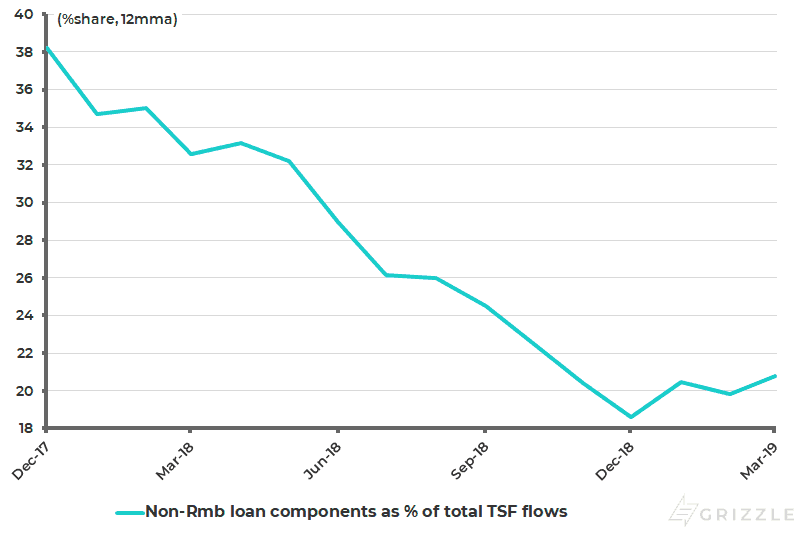
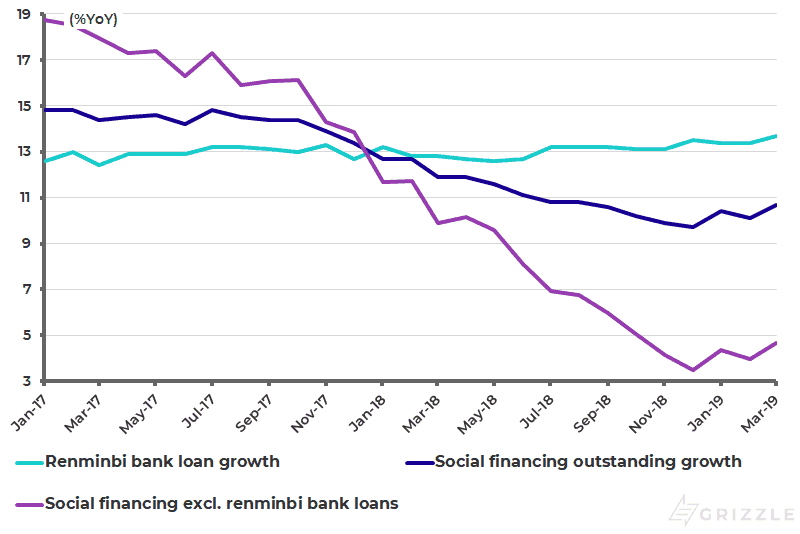
Renminbi bank loan growth also rose from 13.4% YoY in February to 13.7% in March, while the share of non-renminbi loan components as a percentage of total social financing flows has risen from an annualized 19% in December to 21% in March (see following chart). As for China’s bizarrely named social financing aggregate itself, total social financing outstanding rose by 10.7% YoY in March, again up from 10.1% in February and a recent low of 9.7% reached in December (see following chart).
Non-renminbi loan components as % of total social financing flows (annualized)
China social financing outstanding growth and renminbi loan growth
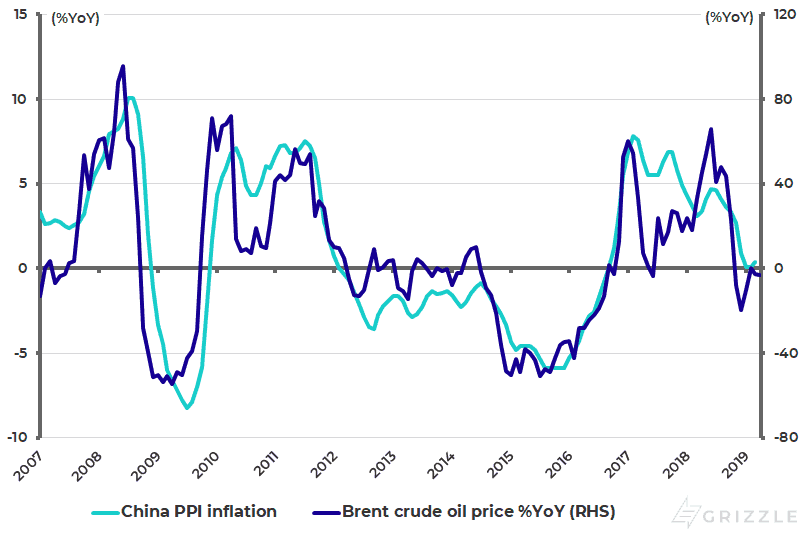
From a more macro standpoint, it is also the case that it increasingly looks like Chinese Producer Price Index (PPI) has bottomed along with the oil price. The Brent crude oil price declined by 42% from a high of US$86.7/barrel in early October 2018 to a recent low of US$49.9 in late December and has since risen by 41% to US$70.5. China PPI inflation rose from a low of 0.1% YoY in January and February to 0.4% YoY in March, after declining from 4.7% in June 2018 (see following chart).
China PPI inflation and Brent crude oil price %YoY
The Biggest Risk to the Chinese Economy
If the above are the positives, perhaps the biggest risk to the Chinese economy this year is renewed weakness in the residential property market caused by the cut in government funding of the shantytown redevelopment scheme. Still, this should not prove that serious a problem.
In this respect, the National Development and Reform Commission (NDRC) announced on April 8 a document detailing the relaxation of Hukou rules, particularly concerning cities with populations of 1-3 million and 3-5 million. Hukou is a household registration system in China which restricts mobility. Thus, all Hukou restrictions in cities with a population of 1-3 million will be scrapped and in cities with a population of 3-5 million will be significantly loosened. The result will be a further pickup in demand for residential property in those smaller tier-2 cities with populations of 3-5 million.
This should be further good news for China’s major property developers which have been benefiting from the ongoing consolidation in the industry as a result of the financing squeeze implemented by the deleveraging policy since 2016.
The top 10 developers are now estimated to account for about 26% of the total market as measured by value. Investor recognition of the benefits of the consolidation, as well as easing financing conditions, are clear in the 48% rally in the MSCI China Property Index since October 2018.
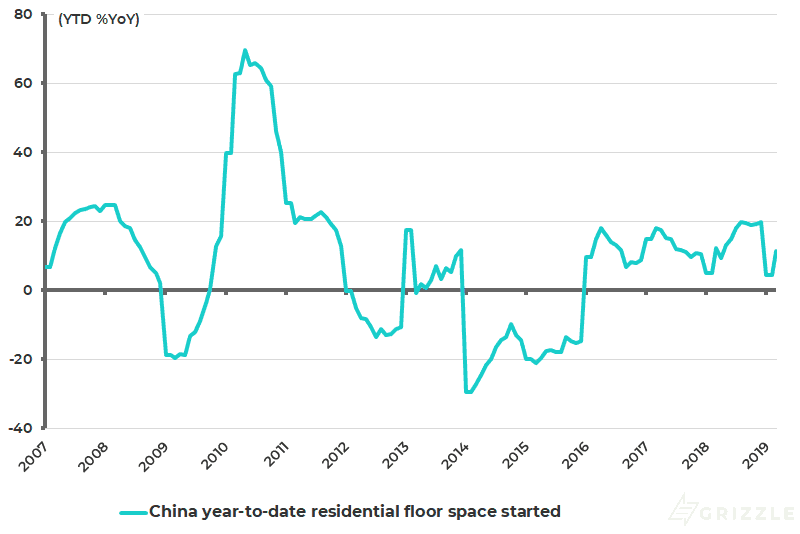
Large developers have accumulated large land banks in tier-2 and large tier-3 cities in the past three years. As a result, developers will focus this year more on construction than land purchases. Indeed land purchases are expected to continue to decline while construction holds up. Residential floor space started rose by 11.5%YoY in the first quarter of 2019, following a 19.7% increase in 2018, according to the National Bureau of Statistics (see following chart).
China residential floor space started
The Schizophrenic Chinese Property Market
If this is the situation for leading developers, what about the overall Chinese property market? Here the story is rather more mixed since expanding Hukou reform will lead to a further migration into the big cities which means reduced demand for residential property in smaller tier-3 and tier-4 cities. A further negative this year is a significant cut in government funding of the shantytown redevelopment scheme in 2019 which will result in reduced demand for residential units in smaller cities.
The conclusion is that China’s residential property market remains highly schizophrenic given the differing fundamentals of the big and small cities. This is why bearish tales of “debt bubbles” and “empty cities” have always been over-simplistic while containing some grains of truth. But the major property stocks are more straightforward since their prospects are geared to the big cities where there is genuine demand amid ongoing urbanization.
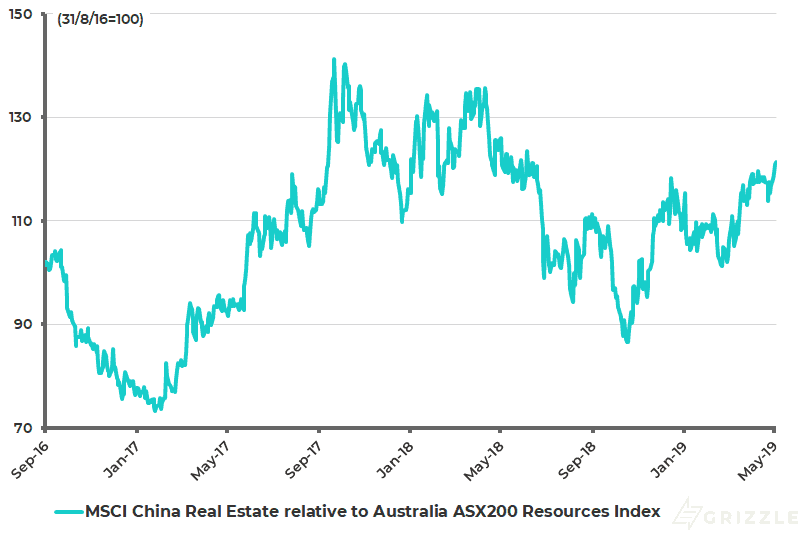
The China property sector remains the key risk for materials demand in the second half of this year. But that is probably more of a risk for Australian resource stocks than Chinese property developers since the latter are benefiting from industry consolidation and strong demand in the biggest cities, as already discussed. This can be illustrated by the extent to which Chinese property stocks have outperformed Aussie resource stocks since October 2018. The MSCI China Real Estate Index has outperformed the ASX200 Resources Index by 40% since mid-October 2018 (see following chart).
MSCI China Real Estate Index relative Australia ASX200 Resources Index
The views expressed in Chris Wood’s column on Grizzle reflect Chris Wood’s personal opinion only, and they have not been reviewed or endorsed by Jefferies. The information in the column has not been reviewed or verified by Jefferies. None of Jefferies, its affiliates or employees, directors or officers shall have any liability whatsoever in connection with the content published on this website.
The opinions provided in this article are those of the author and do not constitute investment advice. Readers should assume that the author and/or employees of Grizzle hold positions in the company or companies mentioned in the article. For more information, please see our Content Disclaimer.