The world is set up for the ironic spectacle of mounting pressure from Washington on OPEC to pump more oil at the forthcoming OPEC+ meeting scheduled for 4 November at the same time as the great and the good will be meeting in Glasgow for the UN Climate Change Conference to sign up to ever more ambitious decarbonisation targets.
Still, the recent energy price spike means, at least, that politicians in the Western world will have to start becoming more honest about the cost of the energy transition, most particularly for lower-income families.
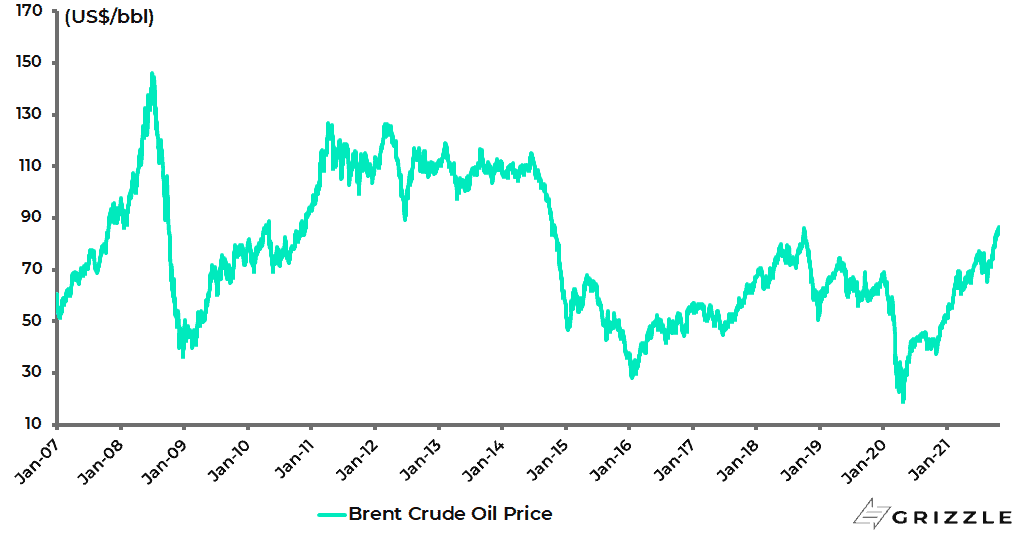
The Brent crude oil price has risen by 31% since a short-term low on 23 August and is now up 63% year to date (see following chart).
Brent crude oil price
Source: Bloomberg
This price move has been driven as much by supply issues as demand ones; though it is worth recording that OPEC is now forecasting global oil demand increasing by 4.15m barrels a day to 100.76m bpd in 2022, a significant upward revision of 867,000 bpd from its forecast increase of 3.28m bpd made in August.
On the supply story, the key issue remains the lack of investment, and the resulting lack of supply, as a consequence of the escalating political attack on fossil fuels witnessed in recent years at a time when the world still depended on fossil fuels for 83% of its primary energy demand in 2020, according to BP’s Statistical Review of World Energy 2021.
The above raises the question of what will happen to energy prices if the pandemic really ends and a real proper reopening of the world economy actually occurs.
The answer is that such a development has the potential to intensify dramatically any inflation scare as a result of surging energy prices.
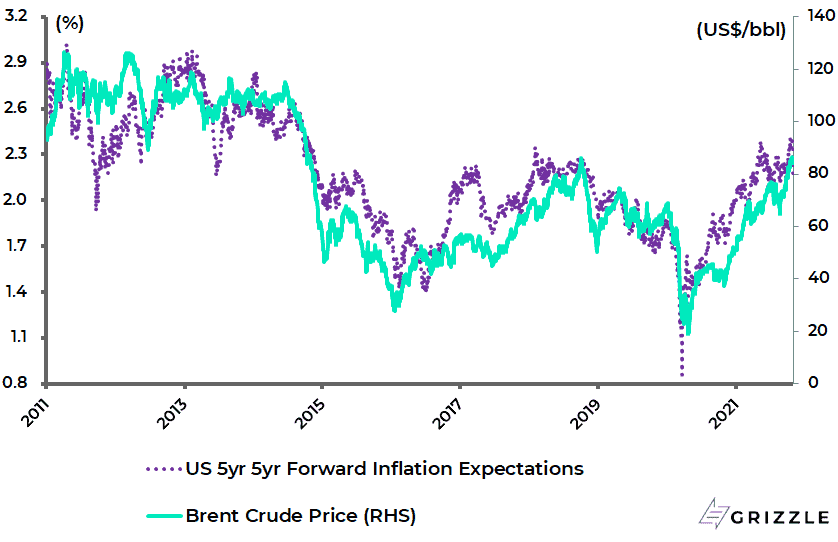
Already there are legitimate concerns, for the first time since the oil crises of the 1970s and 1980s, about stagflation in those economies which are net importers of energy. In this respect, it is worth highlighting again the close correlation between inflation expectations and the oil price.
The correlation between the Brent crude oil price and the US 5-year 5-year forward inflation expectation rate has been 0.90 since 2011.
US 5-year 5-year forward Inflation Correlation
Source: Bloomberg
Surging Energy Prices Mean More Government Spending and More Inflation
Meanwhile, the political reality is that the surge in energy costs, and the related increasingly stagflationary outcomes, is likely to lead to Western governments spending more taxpayers’ money, or perhaps more likely central bank-created money, to subsidize consumers and, therefore, electorates from at least some of the costs of the hyped energy transition.
Such policies will only add to the inflationary dynamic and are again likely to be endorsed by central bankers leaning into the prevailing political winds.
If this is the short-term issue facing markets, there is also a longer-term one.
That is the long-term cost of decarbonising the world economy by, say, 2050.
This writer has seen estimates ranging between US$60-80tn.
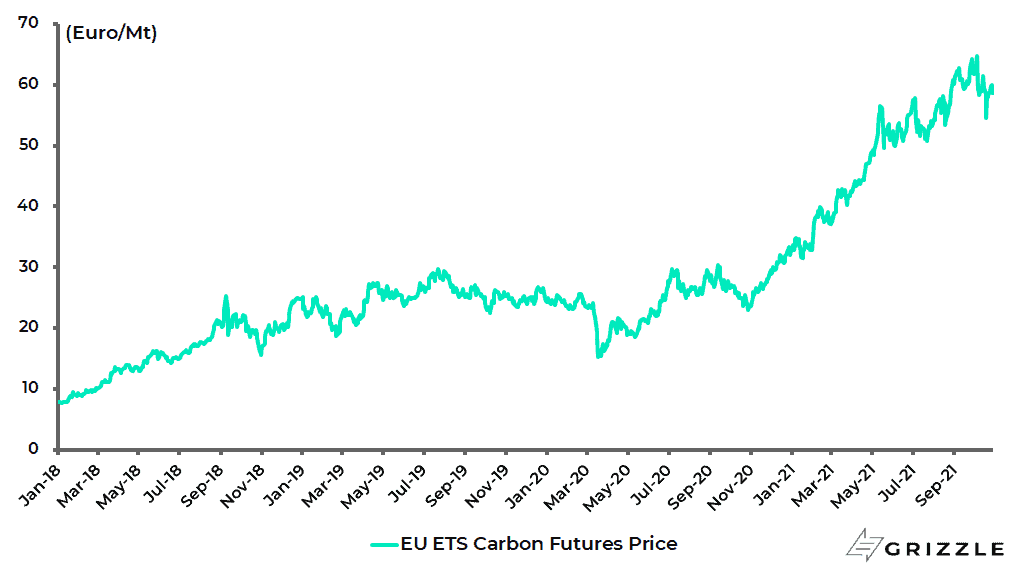
The US$80tn number is derived by multiplying the current EU Emissions Trading System (ETS) carbon market price of €58.7 (US$67.7) per tonne by the global CO2 emission of 40bn tonnes currently generated annually.
The theory is that, if companies were forced to pay for all their emissions at current EU ETS rates, the cost would be US$2.7tn per annum for 30 years, or US$80tn assuming the carbon market price remained constant in the calculation period which of course is unlikely.
EU ETS carbon market price
Source: Bloomberg, ICE ENDEX
Inflation, Transitory or No?
Meanwhile, aside from the inflationary impact of the evolving energy crisis, there remains the continuing important related debate in the financial markets over whether the pickup in inflation witnessed in the Western world this year is transitory or not.
The base case here, until proven otherwise, remains that, if inflation does prove less transitory than assumed, then the Fed and other G7 central banks will not tighten in any meaningful manner.
Rather they will proceed further in the direction of policies of financial repression, as signaled by the ever growing central bank involvement in government bond markets.
In this respect, the base case of this writer remains the same as it has been since the second quarter of last year, namely that the policy response to Covid-19 in the G7 world, in terms of the growing convergence of fiscal and monetary policy, will mark the beginning of the end of the disinflationary era which has been the prevailing trend since former Fed chairman Paul Volcker defeated inflation in the late 1970s and early 1980s by imposing high real interest rates on the US economy.
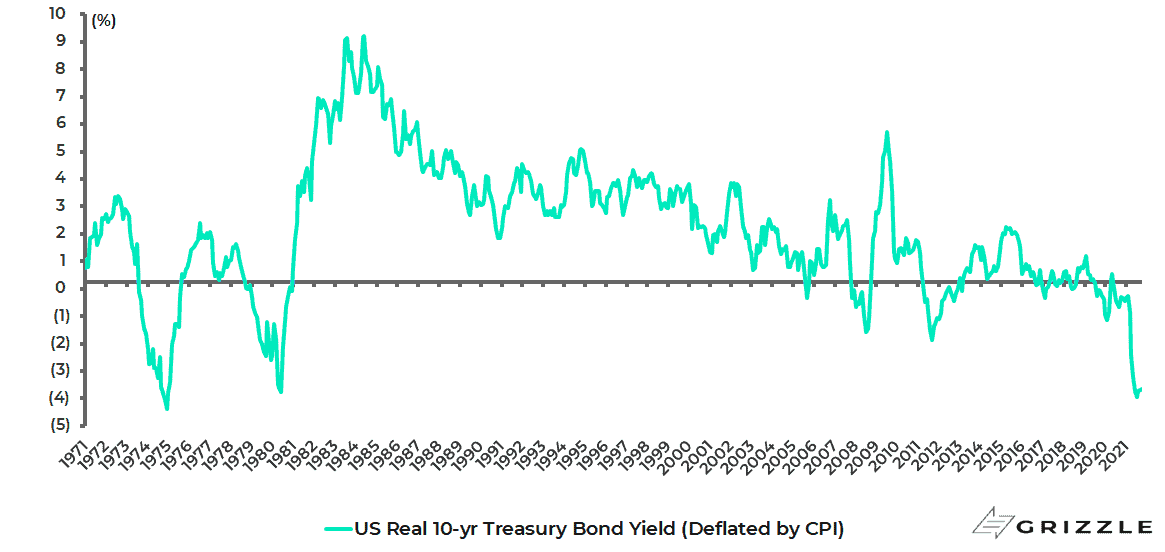
It is worth recording again for those unaware of the history that the real 10-year Treasury bond yield, deflated by CPI, peaked at 9.1% in 1983 or in nominal terms at 15.8% in 1981.
The 10-year Treasury bond yield is now at the other extreme, running at a negative 3.6% in real terms and 1.55% in nominal terms.
This highlights the extent to which the current Fed has abandoned the legacy bequeathed by the late and great Volcker.
US real 10-year Treasury bond yield (deflated by CPI)
Source: Bloomberg, US Bureau of Labor Statistics
The reason the above view is maintained is based primarily on a political judgment, not an economic one.
Despite the reality that lower-income households suffer more from a general pickup in prices, the current political context makes it hard to engage in meaningful monetary tightening.
And any G7 central banker with the integrity to try and do so is likely to be replaced by his political masters.
Government Handouts are Fueling Strong Consumer Demand
Meanwhile, there has been a lot of ex post facto rationalization by G7 central bankers in recent months as to why inflation has surprised due to the unusual circumstances of the pandemic, as pent-up demand on the reopening encountered disrupted supply chains.
The demand was fueled by the surge in household savings, driven in the G7 world by the directly related surge in transfer payments.
On this point, it is worth updating again the extent to which American households, for example, have been net financial beneficiaries of the pandemic based on the latest data.
Thus, US households have now lost US$61bn in personal income in the 19 months since the arrival of Covid and related lockdowns but received US$2.23tn more in transfer payments, based on data from the Bureau of Economic Analysis.
This is measured by comparing personal income/transfers over the 19 months to September 2021 with the pre-Covid level in February 2020.
As a consequence, US personal savings have increased by US$2.33tn over the same period.
Still, not all this money has been spent.
US personal Income and Savings
| US$bn, saar | Feb-20 (Pre-Covid) |
Sep-21 | Mar20-Sep21 (Average) |
Mar20-Sep21 Chg vs Feb-20 |
| Personal income (excl. transfers) | 17,287 | 18,177 | 17,248 | (61) |
| Personal current transfer receipts | 3,208 | 3,913 | 4,617 | 2,231 |
| Disposable personal income | 16,735 | 17,882 | 18,025 | 2,042 |
| Personal outlays | 15,342 | 16,546 | 15,162 | (285) |
| Personal saving | 1,392 | 1,336 | 2,862 | 2,327 |
| Personal saving/disposable income (%) | 8.3 | 7.5 | 15.9 | 7.6 |
Note: Personal income includes compensation of employees, proprietors’ income, rental income, interest and dividend incomes.
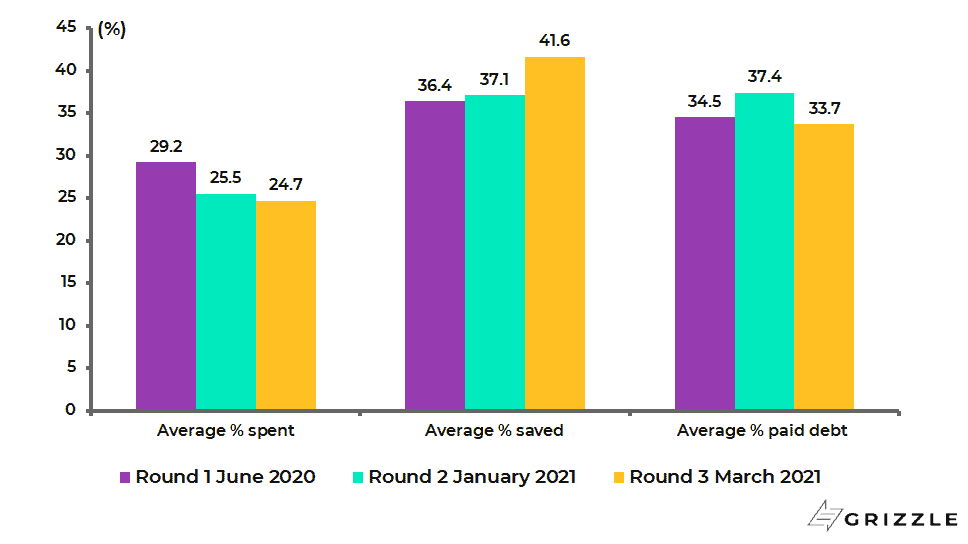
The New York Fed’s consumer surveys suggest that Americans spent only 29% of their first round of stimulus cheques last year, 26% of the second round and 25% of the third round in March.
How American households use their stimulus checks
Source: New York Fed Survey of Consumer Expectations (SCE)
But that is in part because risk aversion still lingers since the pandemic is not over.
It is also the case that the federal government’s supplementary unemployment benefit of US$300 a week only finally ended on 6 September.
This will lead to a significant decline in monthly income for many American households.
It will be interesting to see if this prompts more Americans to return to the workforce.
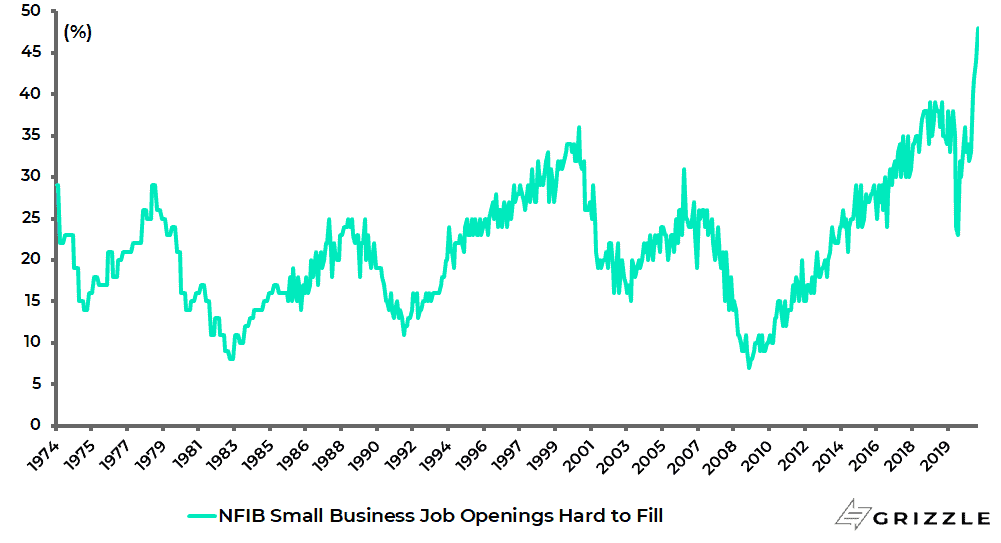
For now, the latest survey of small businesses shows continuing extreme difficulty in finding labour.
The percentage of US small businesses reporting job openings that could not be filled rose from 50% in August to a new record high of 51% in September.
US NFIB Small Business Survey: Job openings hard to fill
Source: National Bureau of Independent Business
Labor Costs and Rents are Soaring, CPI is Likely to Follow
It is clearly superficially appealing for the transitory camp to argue that US CPI inflation has already peaked because of the base effect and that conditions will return to normal once the pandemic passes.
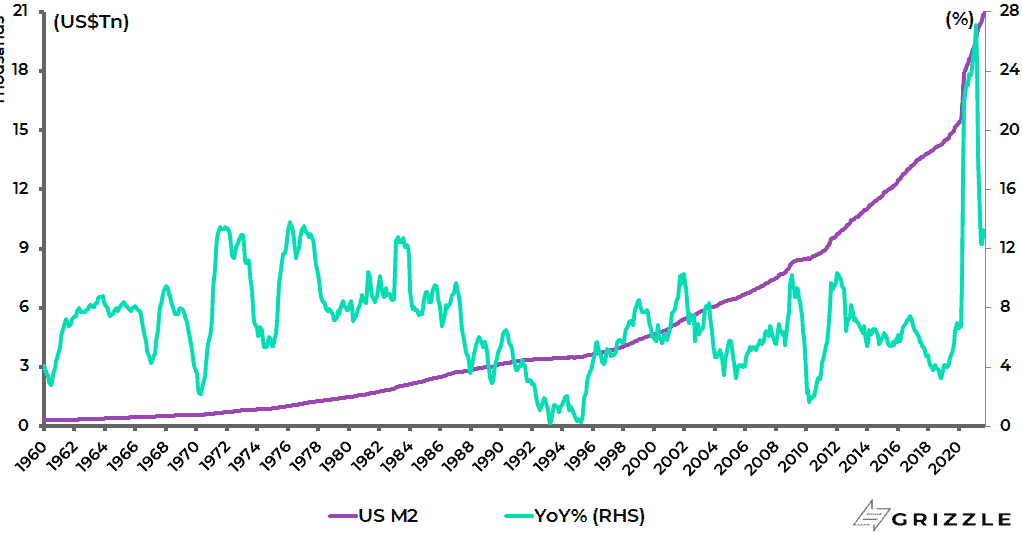
Still, investors also need to remember the macroeconomic context of soaring US money supply growth since the onset of the pandemic. While the rate of M2 growth in America has declined on a YoY basis, it is still very high in absolute terms from the perspective of history.
US M2 growth slowed from a record 27.1% YoY in February to 12.8% YoY in September, compared with a pre-pandemic average of 6.8% since the series began in 1960.
US M2 level and M2 growth
Source: Federal Reserve
Meanwhile, the key statistic is that US M2 has increased in absolute terms by 36% (21% annualised) since March 2020 when the monetary policy response to the pandemic commenced.
This is highly relevant for those who believe that inflation, ultimately, is always a monetary phenomenon.
This writer has a lot of sympathy with that view though, clearly, the trend in financial deregulation from the early 1980s in the Western world increased the importance of credit growth relative to money supply growth.
But for the many neo-Keynesian economists who do not accept the monetarist theory of inflation, wage costs tend to be all-important.
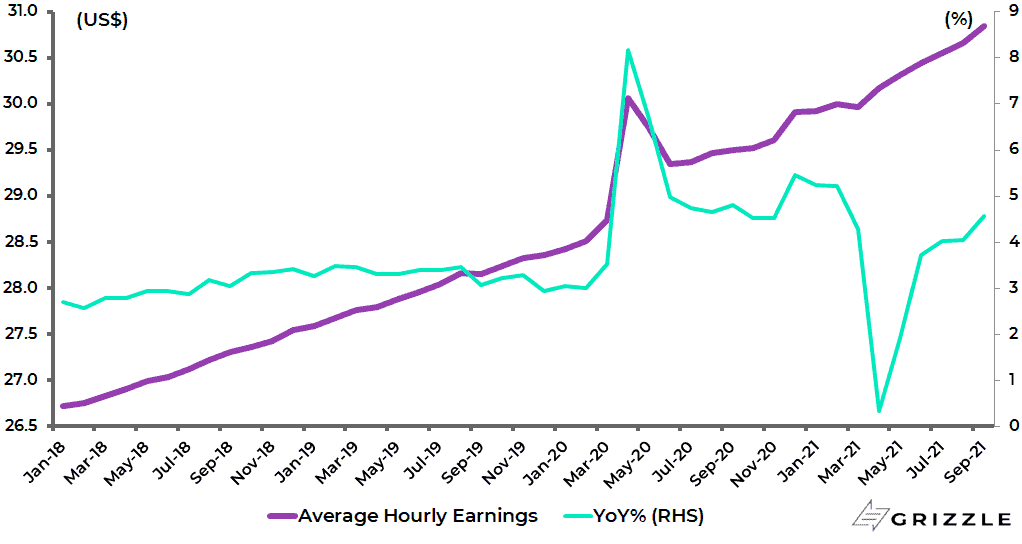
On this point, average hourly earnings growth is now running at an annualised rate of 6.0% over the past six months to September with the October data due to be released on 5 November.
US average hourly earnings of private employees
Source: Bureau of Labor Statistics
The other point is that the Fed has now, as a consequence of its recently concluded strategic review, formally dispensed with the Phillips Curve in terms of the previously assumed trade-off between inflation and unemployment.
This continues to mean that the American central bank will likely not be pre-emptive in response to rising wage pressures which in turn means that the labour market will run hotter.
Meanwhile, the already discussed growing evidence of a generalised rise in prices will cause consumers increasingly to focus on the decline in their purchasing power in real terms.
US consumer purchasing power declined by 4.9% YoY in September and is down an annualised 2.5% over the past five years.
This in turn will lead to more pressure for wage increases.
US purchasing power of consumer dollar (log scale)
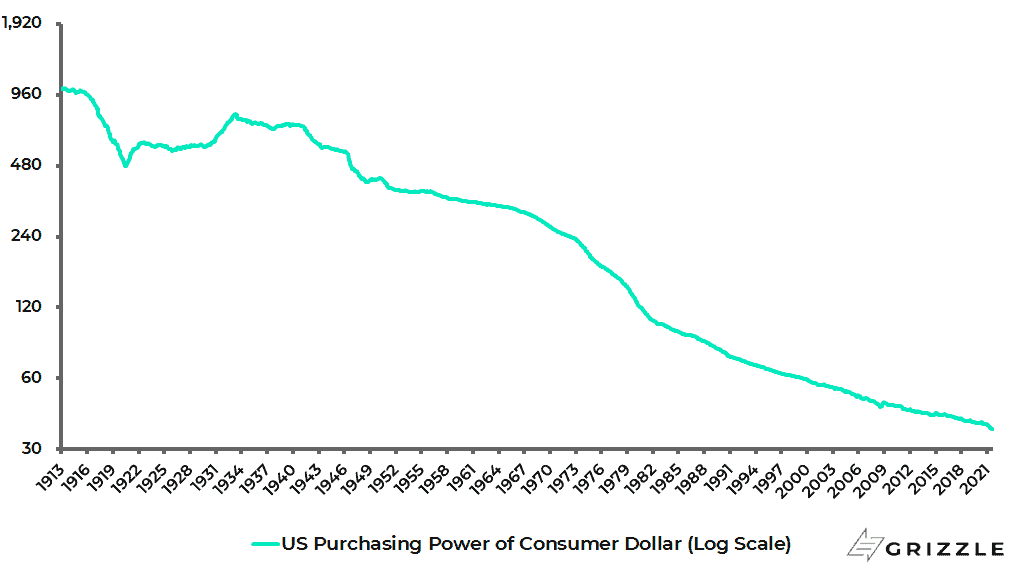
Note: This measures the change in the value to the consumer of goods and services that a dollar can buy.
Derived from US CPI data. Source: US Bureau of Labor Statistics
Do Rising Rents Mean Inflation Readings are About to Play Catchup?
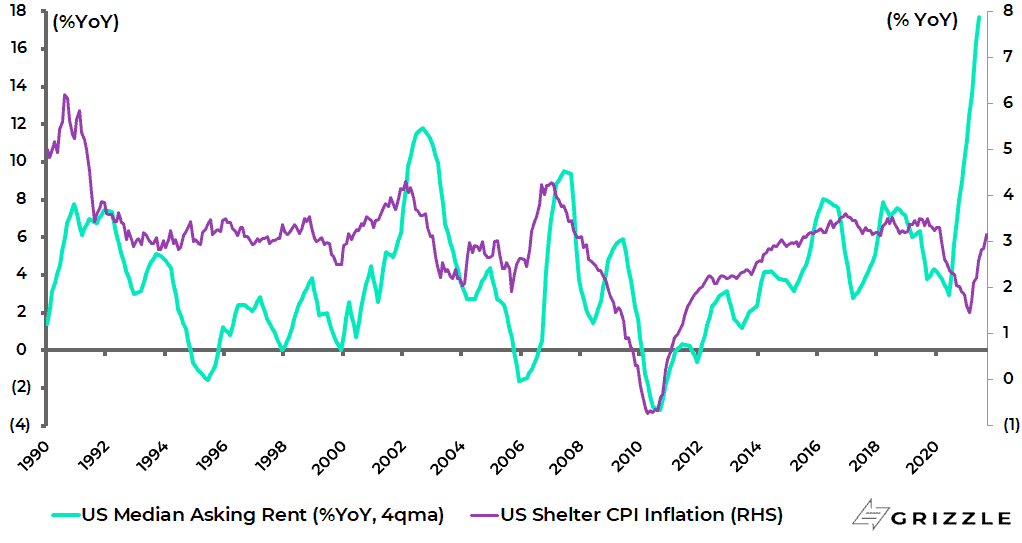
The other area which can materially influence reported inflation in America is rents.
This is because the so-called shelter component accounts for 41% of core CPI.
The Census Bureau’s median asking rent rose by 18% YoY in the four quarters to 2Q21 but, so far, shelter CPI is lagging and rose by only 3.2% YoY in September.
There is then a lot of room for shelter to play catch up.
US median asking rent and shelter CPI inflation
Source: Bureau of Labor Statistics, Census Bureau
About Author
The views expressed in Chris Wood’s column on Grizzle reflect Chris Wood’s personal opinion only, and they have not been reviewed or endorsed by Jefferies. The information in the column has not been reviewed or verified by Jefferies. None of Jefferies, its affiliates or employees, directors or officers shall have any liability whatsoever in connection with the content published on this website.
The opinions provided in this article are those of the author and do not constitute investment advice. Readers should assume that the author and/or employees of Grizzle hold positions in the company or companies mentioned in the article. For more information, please see our Content Disclaimer.
