
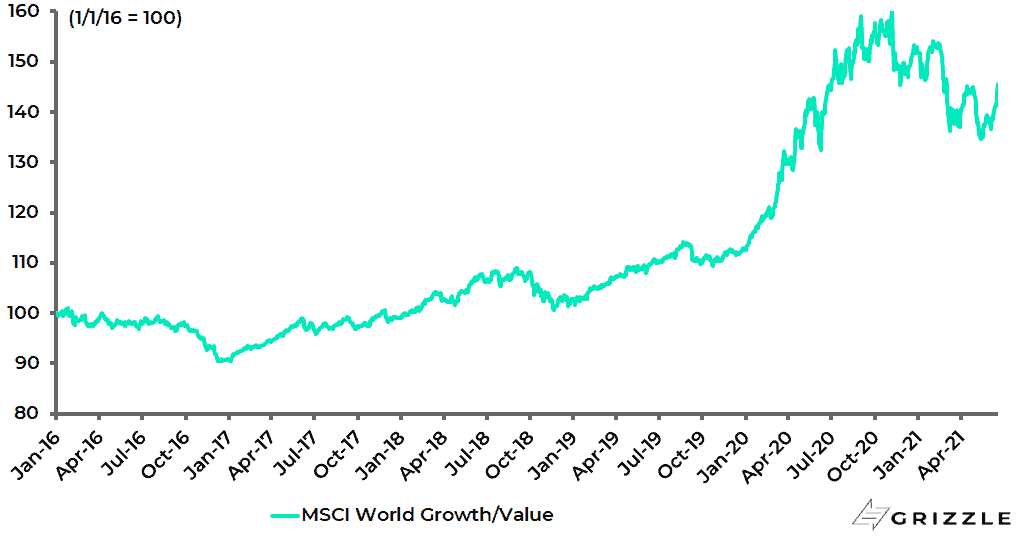
Despite the sell-off in cyclical stocks triggered by the Federal Reserve meeting last week, the MSCI World Growth Index has underperformed the MSCI World Value Index by 9.2% in US dollar terms since 9 November 2020 on a total-return basis.
MSCI World Growth Index relative to MSCI World Value Index
Meanwhile, last week’s Fed meeting was hardly dramatic with the major ‘newsworthy’ development that Fed governors now expect to raise rates by 50bp in 2023 whereas previously they had expected no rate hikes at all.
Given the Fed’s dismal forecasting record it is a bit hard to see why the markets have reacted.
Still, from the Fed’s standpoint, it does show that Fed chairman Jerome Powell is no longer not even thinking about raising rates.
Meanwhile, it also remains the case that the timing of the severity of the inflation scare will most likely be determined by what happens with inflation expectations.
Here there has been some recent easing of pressures.
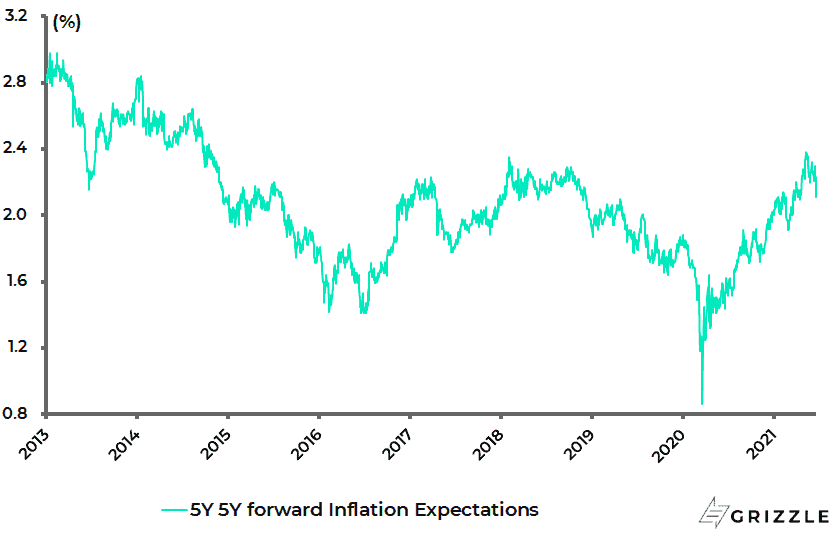
The 5-year 5-year forward inflation expectation rate, which is the main one this writer is tracking, rose from 2.22% on 4 May to 2.38% on 11 May, the highest level since October 2014, and is now 2.11%.
The 5-year 5-year forward inflation expectation rate measures the expected inflation over the five-year period that begins five years from now.
US 5-year 5-year forward inflation expectation rate
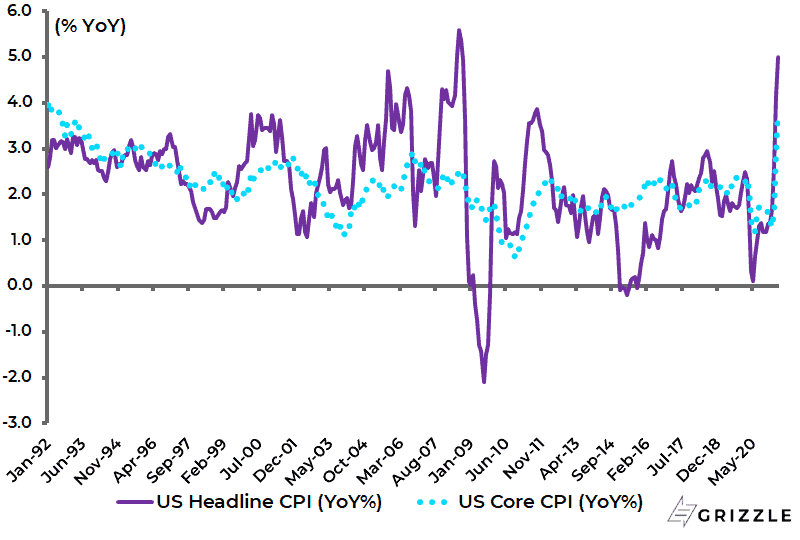
As for the latest inflation data released last week, US headline CPI inflation rose from 4.2% YoY in April to 5.0% YoY in May, the highest level since August 2008.
While core CPI inflation rose from 3.0% YoY to 3.8% YoY, the highest level since June 1992.
US CPI Inflation
Will Worker Scarcity Pump up Wages?
Meanwhile, US job growth has continued to run below expectations. Nonfarm payrolls increased by 559,000 in May, compared with consensus estimates of 675,000.
US monthly change in nonfarm payrolls

The most plausible explanation is that, if people are incentivised not to work, they will either not look for work or at least not report that they are working.
Remember an estimated 42% of unemployed Americans have been receiving more than they would be if at work. This is why it is an important issue whether the federal government’s Covid-related US$300/week “enhanced unemployment benefit” is extended when it is due to expire in September.
Such an extension at present looks unlikely.
Indeed 25 Republican-governed states have already announced that they will opt-out of the programme as early as 12 June precisely because the extra benefits are discouraging people from returning to work.
There are also other policies in place, the expiry of which could influence the behavior of economic participants.
The mortgage foreclosure moratorium is scheduled to expire at the end of June and the student loan moratorium at the end of September.
To the extent that such government programmes are removed, that should increase the incentive to look for work.
Meanwhile, the fewer people looking for work, the greater the pressure for wages to rise.
Indeed the latest small business survey released in early June showed that the percentage of small businesses reporting job openings that could not be filled rose further from 44% in April to a new record high of 48% in May.
NFIB Small Business Sentiment Survey: Job Openings Hard to Fill
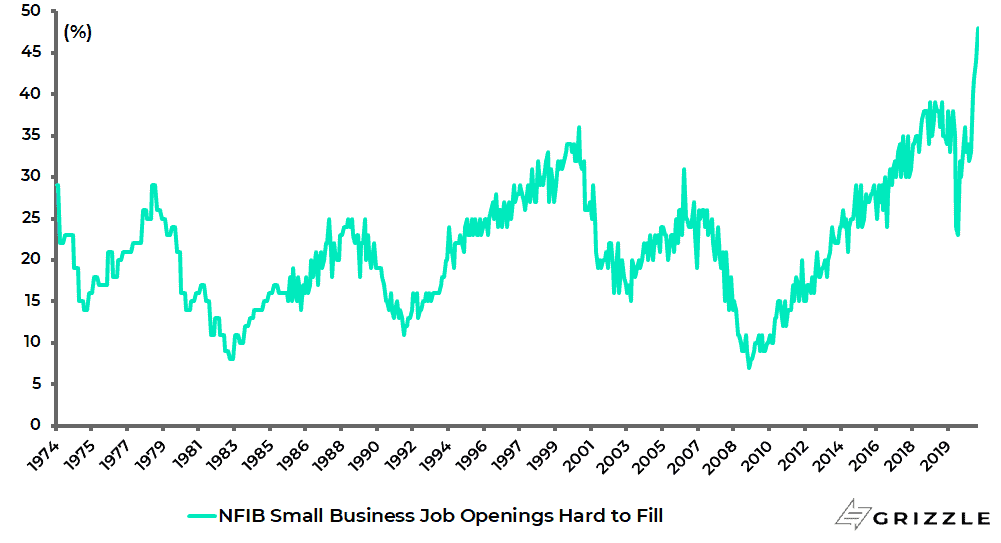
This data point adds to the evidence of rising wage pressures in the US.
The latest data shows both rising wage pressure and rising number of hours worked.
Average hourly earnings increased by 15 cents or 0.5% MoM to a record US$30.33 in May, following an increase of 21 cents or 0.7% MoM in April, while the average weekly hours worked rose from 34.1 hours in March 2020 to 34.9 hours in March-May 2021.
US average hourly earnings and average weekly hours worked of private employees
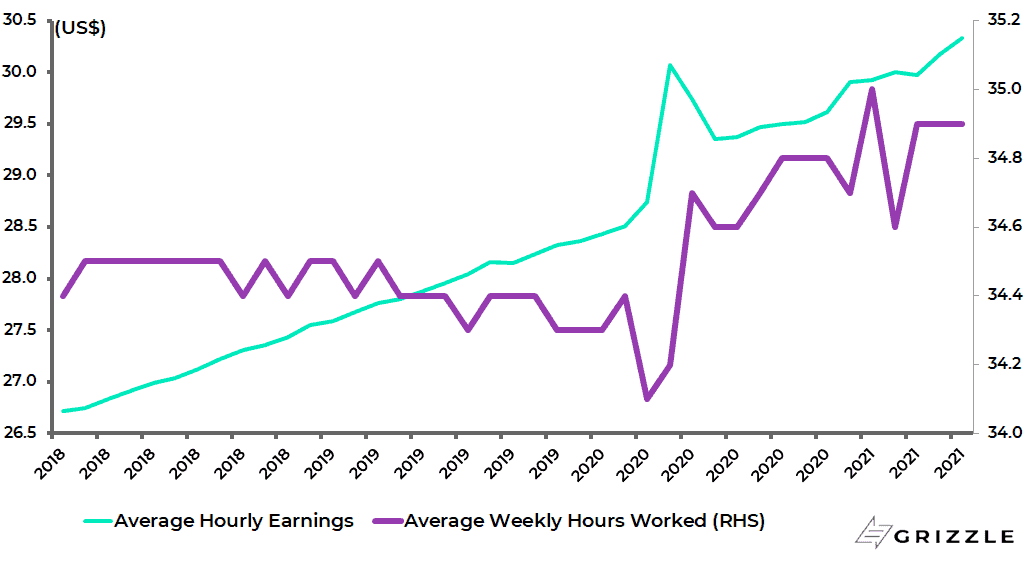
If this is positive from a consumption standpoint, it also raises inflationary risks.
Certainly, the Fed’s current continuing stance, namely that inflationary pressures on the re-opening will prove transitory, will come under more scrutiny the more there is evidence of wage pressures.
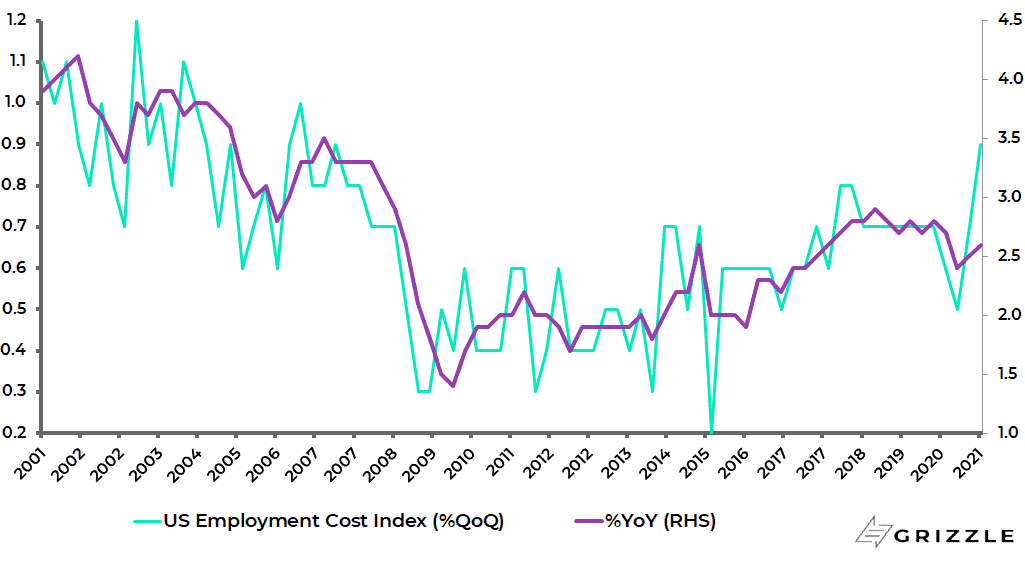
In this respect, it is also interesting that the employment cost index shows wages having accelerated for the past two quarters.
The employment cost index rose by 0.9% QoQ in 1Q21, up from 0.7% in 4Q20 and 0.5% in 3Q20. This is the biggest QoQ growth since 3Q06.
US employment cost index
Still, rising wage pressures will be much more important for the Fed if accompanied by a further rise in inflation expectations.
For the Fed’s whole mantra has been that it will stick with its doveish approach, in terms of the willingness to overshoot the 2% inflation target, unless there is concrete evidence that longer-term inflation expectations have been destabilised.
On this point, Fed vice chairman Richard Clarida said in a speech in May: “If, contrary to our baseline view, demand relative to supply was excessive and persistent and pushed up inflation and inflation expectations to levels that were not potentially consistent with our mandate, we would not hesitate to act and to use our tools to bring inflation back down to our 2% longer-run goal.”
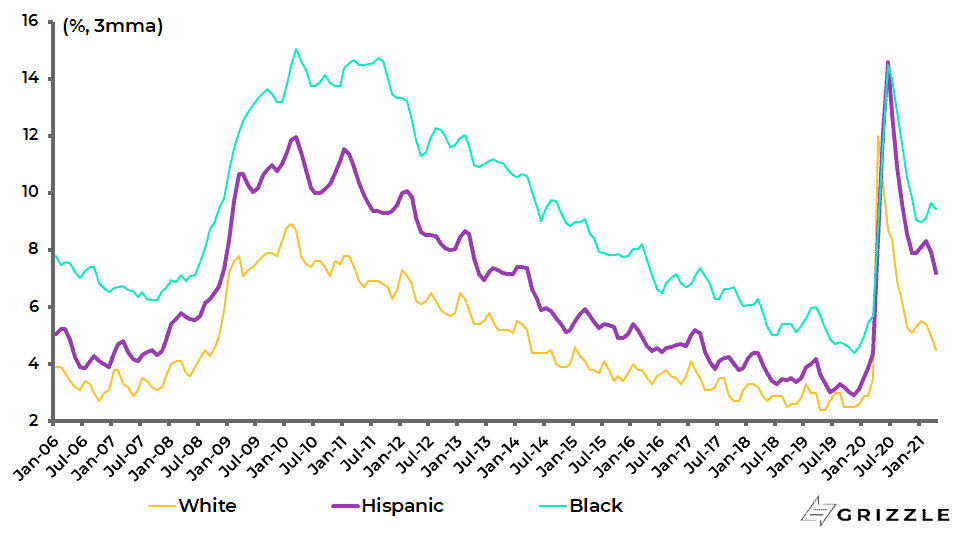
Meanwhile, it also should be remembered that the Fed is also seemingly targeting both full and “inclusive” employment.
As regards the goal of inclusive employment, the average gaps between the prime-age (25-54) white unemployment rate and the prime-age Black and Hispanic unemployment rates were 4.4ppts and 1.9ppts respectively for the three months to May.
US White, Black and Hispanic prime-age (25-54) unemployment rates
Fed Governor Lael Brainard, a prominent dove, also stated in a speech in mid-May that “employment and inflation are far from our goals”.
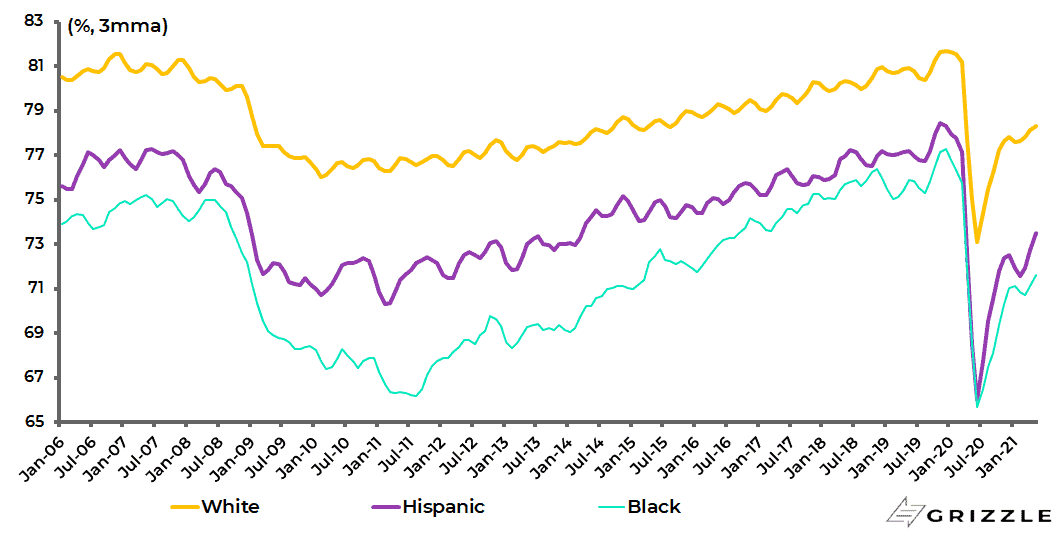
Brainard noted that the employment-to-population ratio for Black prime-age workers, at then 72.1%, was still over 6ppts lower than the white prime-age employment-to-population ratio, while the gap for Hispanic prime-age workers relative to white workers was almost 5ppts.
The May employment data released earlier this month shows that the situation remains that the Black prime-age employment-to-population rate, at 72.1%, is still 6.3ppts lower than the white prime-age employment-to-population ratio; while the gap for Hispanic workers and white workers is 4.5ppts.
US White, Black and Hispanic prime-age (25-54) employment to population ratios
The views expressed in Chris Wood’s column on Grizzle reflect Chris Wood’s personal opinion only, and they have not been reviewed or endorsed by Jefferies. The information in the column has not been reviewed or verified by Jefferies. None of Jefferies, its affiliates or employees, directors or officers shall have any liability whatsoever in connection with the content published on this website.
The opinions provided in this article are those of the author and do not constitute investment advice. Readers should assume that the author and/or employees of Grizzle hold positions in the company or companies mentioned in the article. For more information, please see our Content Disclaimer.