The cyclical trade continues to be recommended here, despite the ongoing COVID “second wave”.
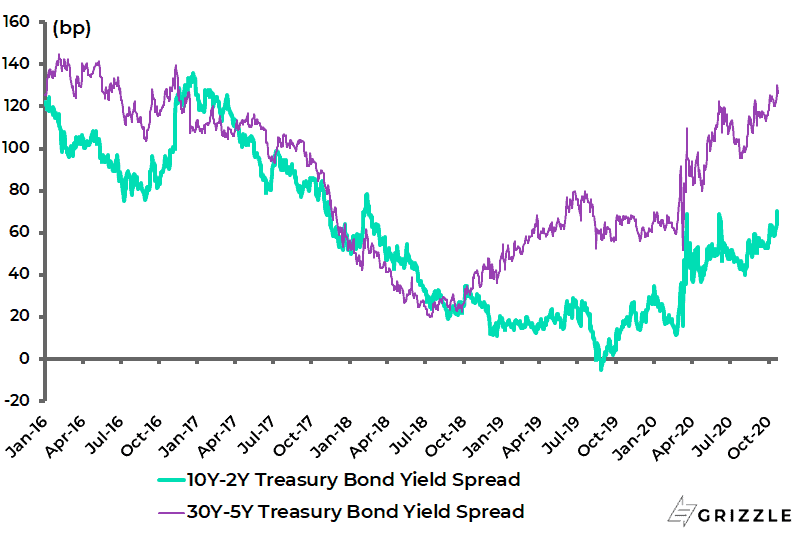
On this point, it is interesting that the US Treasury 5-year-30-year spread shows much more yield curve steepening than the 2-10.
The US 30-year-5-year Treasury bond yield spread has risen by 57bp so far this year and is up 107bp since July 2018.
By contrast, the 10-year-2-year spread has risen by 34bp year-to-date and is up 44bp since July 2018.
US 30Y-5Y and 10Y-2Y Treasury Bond Yield Spreads
Why is that?
The guess would be that the relative lack of movement in the 10-year since the huge volatility in March reflects investors’ expectations of yield curve control, expectations that are shared here.
This means the volatility has moved more to the 30-year in the intervening period.
The 10-year Treasury bond yield has risen by only 17bp since the end of March, compared with a 32bp increase in the 30-year Treasury bond yield.
The same phenomenon has happened in Japan since the 10-year JGB was effectively pegged at zero by the Bank of Japan in 2016.
The 30-year-5-year JGB yield spread has risen by 37bp since mid-2016 to 74bp, while the 10-year-2-year JGB yield spread is up by only 8bp over the same period to 16bp.
Japan 30Y-5Y and 10Y-2Y JGB Yield Spreads

All this means that for those who expect a second wave of deaths, as well as cases, in the coming Northern Hemisphere winter, the bond to buy is the 30-year Treasury.
Yield Curve Control Still the Base Case
But on the base case here, namely more evidence of cyclical recovery, the Fed will react to yield curve steepening by adopting yield curve control, thereby sending a clear message that Powell has indeed become “the Anti-Volcker”, as the Wall Street Journal aptly described him in an editorial last month (see Wall Street Journal article: “Powell Becomes the Anti-Volcker”, 17 September 2020).
In this respect, yield curve control will be the signal that the Fed is determined to inflate its way out.
Meanwhile, if Joe Biden wins the presidential election, as looks increasingly likely, the word is that the dovish Fed governor Lael Brainard will become Treasury Secretary.
That would be appropriate since such an appointment would symbolise the ongoing convergence of fiscal and monetary policy.
Brainard has in the past often spoken about yield-curve control as a policy option.
What about the impact of a Biden victory and a Democrat sweep of Congress on the US economy?
It would again be a positive for the cyclical trade because hopes will rise of a major infrastructure stimulus as well as, of course, the US$2trn Green New Deal.
When it comes to infrastructure packages, the key issue has not been ideology but a divided Congress.
China, India and Farr’s Law
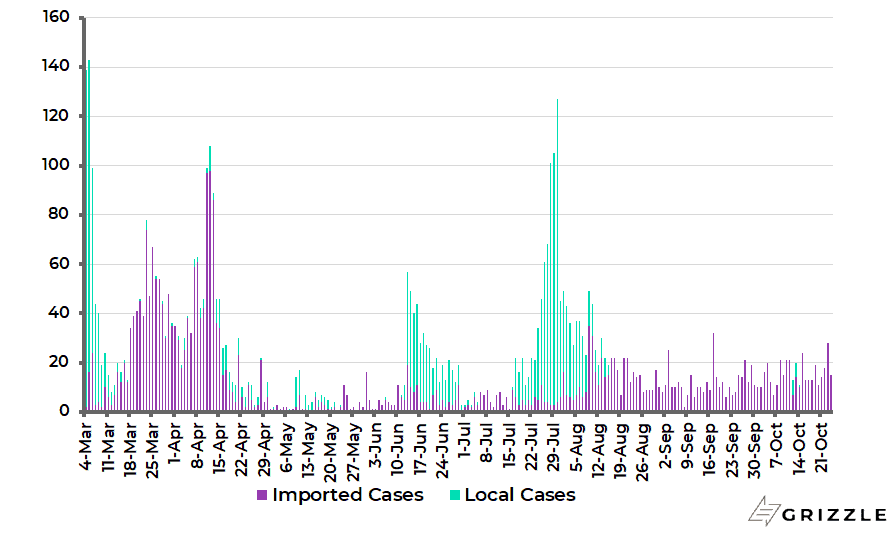
Meanwhile, with so much focus on COVID-19 fallout in the Western world, it is worth remembering that China appears to have defeated COVID-19 in terms of a dramatic collapse in the number of cases or in terms of the number of people hospitalized.
Indeed, the Chinese government has all but declared victory over the pandemic.
The 7-day average daily case count in China has collapsed from a peak of 4,836 in February to 17 at present and an average of 16 since May, while there has been no locally transmitted case over the past nine days and only 13 local cases since mid-August.
There are currently only 265 COVID patients in Chinese hospitals, down from 843 in early August and a peak of 58,016 in mid-February.
China COVID-19 Daily New Cases (Imported and Local Cases)
As for the world’s worst-hit country, India, the number of cases has soared over the past quarter, but the death rate remains comparatively low.
The seven-day average daily case count in India surged five-fold from 18,473 at the end of 2Q20 to a peak of 93,199 in mid-September but has since declined by 43% to 52,894 in what looks, hopefully, like a peaking out of the pandemic.
COVID deaths now total 118,534, or 87 per 1m of population, compared with 683 per 1m of population in the US and 664 in the UK.
India 7-day average COVID-19 daily new cases and Daily Active Cases Added

The above state of play suggests again that the epidemic is in the process of burning itself out, as all epidemics in history have tended to do, following the same Bell-shaped curve, in line with Farr’s Law as discussed here several times previously.
Still, if this is this writer’s assumption for now, that assumption is not shared by many policymakers or indeed market participants.
There is also the continuing thesis propagated by many in the media that the world has entered a “new normal” in terms of working from home or not participating in international travel.
Thus, IATA has forecast that global air passenger traffic will not return to 2019 pre-COVID levels until 2024. That would be significant since the travel and tourism market accounted for 10.3% of world GDP last year, according to the World Travel & Tourism Council.
The Deflationary Era is Over, Buy Cyclicals
It is understandable that such forecasts have been made because human beings have a tendency to extrapolate their present circumstances into the future.
And certainly, dramatic actions restricting human movement have been taken as a result of COVID-19.
For example, virtually all the major Asian countries are still restricting entry only to legal residents and certain strictly defined special groups of visitors, and even then, returning residents have to submit to 14-day quarantines even if they test negative for the virus.
These are extreme measures.
Still, the whole policy response from the onset has been extreme in the sense that, in the history of mankind, it would appear that governments have never locked down whole economies before on account of a pandemic.
This also means that it needs to be stressed again that the economic downturn triggered by COVID-19 is totally different from any previous downturn in history.
That is because it has been driven by government fiat not, as is normally the case, by monetary tightening in response to inflationary overheating or by a deflationary banking bust.
This is particularly the case if the highly stimulatory policies introduced to address the fallout from COVID-triggered lockdowns linger longer than the virus itself.
In this respect, the base case here remains that the policy response to COVID-19 in the G7 world has set in motion dynamics that will mark the beginning of the end of the deflationary era which has been the dominant trend since the early 1980s, ever since former Federal Reserve Chairman Paul Volcker crushed inflation by imposing high real interest rates on the US economy.
The real 10-year Treasury bond yield and 3-month Treasury bill yield, deflated by core CPI, peaked at 8.7% and 6.3%, respectively in 1983, while the real federal funds rate peaked at 9.6% in 1981.
US Real 10-year Treasury Bond Yield (Deflated by Core CPI)

This view is maintained despite the undoubtedly near-term deflationary impact of the lockdowns, as reflected in the further dramatic collapse in velocity that has occurred in 2020.
US, Eurozone and Japan Money Velocity (Nominal GDP/M2)

The views expressed in Chris Wood’s column on Grizzle reflect Chris Wood’s personal opinion only, and they have not been reviewed or endorsed by Jefferies. The information in the column has not been reviewed or verified by Jefferies. None of Jefferies, its affiliates or employees, directors or officers shall have any liability whatsoever in connection with the content published on this website.
The opinions provided in this article are those of the author and do not constitute investment advice. Readers should assume that the author and/or employees of Grizzle hold positions in the company or companies mentioned in the article. For more information, please see our Content Disclaimer.