
The view here remains to continue to favour the back-to-normal cyclical trade on the view that the vaccine rollout story will prevail over the concerns about new Covid variants and related restrictions in economic activity.
True, the cyclical view has become more consensus of late. That said, it has to be wondered whether equity portfolios have switched from growth to cyclicals to that great an extent.
Meanwhile, economists are still not seemingly expecting a pickup in US inflation to the Fed’s targeted 2% in 2021.
Core PCE inflation, the Fed’s favoured target, is expected to rise to 1.8% in 2021, up from 1.4% YoY in 2020, according to Bloomberg.
Still there is a risk the economists will be wrong.
The anecdotal evidence of supply shortages and related price pressures is growing with most of the major automakers, for example, announcing production cuts recently because of semiconductor shortages.
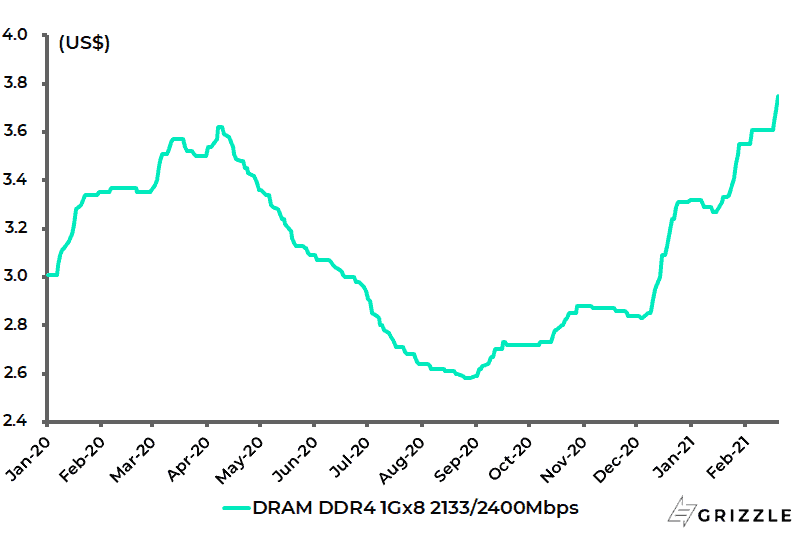
Whether it is rising DRAM prices, or indeed resurgent shipping rates, there is a lot of evidence of supply constraints in the system.
DRAM prices have risen by 33% since early December (see following chart).
DRAM spot price
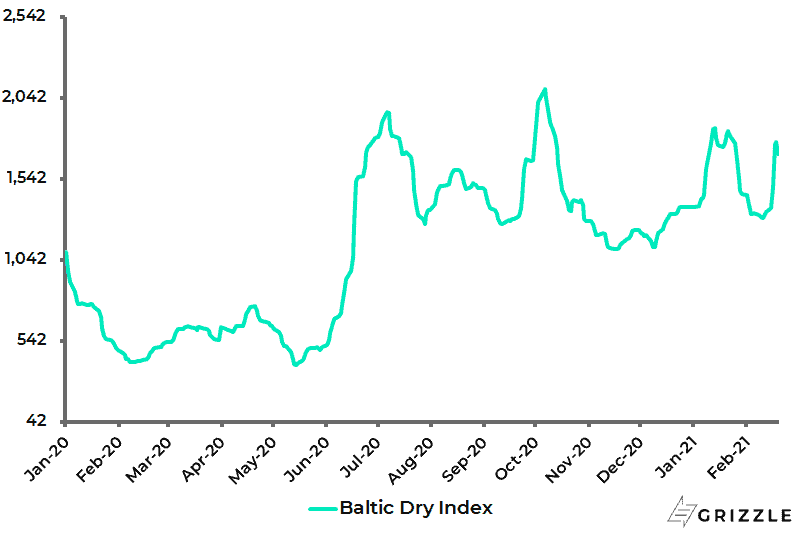
While the Baltic Dry Index has surged by 51% since early December 2020
Baltic Dry Index
What about wages in the US?
Here it might be time to start refocusing on average hourly earnings growth where the latest monthly payroll data showed renewed strength.
US average hourly earnings rose by 5.4% YoY in both December and January, the highest YoY growth since May 2020.
US Average Hourly Earnings Growth
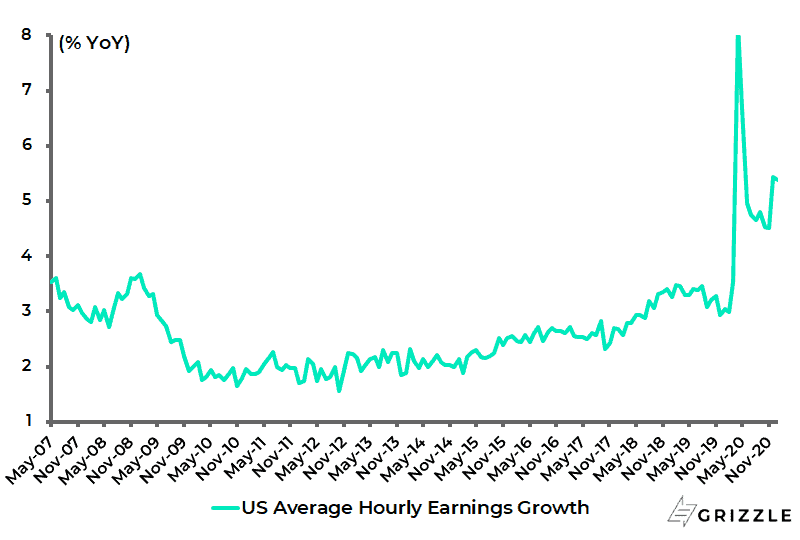
If this is potentially significant, this data is also undoubtedly influenced by the decline in lower-paid jobs with employment in the leisure and hospitality sector collapsing by 536,000 in December, the first decline since April 2020, and down a further 61,000 in January.
High Valuation Stocks at Risk
Meanwhile, any hint of an inflation scare raises the risk of Fed triggered tightening/tapering concerns which would pose a major risk to high PE growth stocks.
On this point, the US stock market is undeniably expensive.
The overvaluation is best highlighted by the ever more extreme divergence between the macro measure of US corporate profits, as published in the National Income and Product Accounts (NIPA) by the Bureau of Economic Analysis, and the S&P500 index.
This divergence is now even more dramatic than it was at the time of the 2000 Nasdaq Internet Bubble.
Thus, annualised corporate profits after tax have risen by only an annualised 0.2% since the start of 2013 based on the macro measure, while the S&P500 is now up 174% from the level at the end of 2012.
US Annualised Corporate Profits after Tax and S&P500
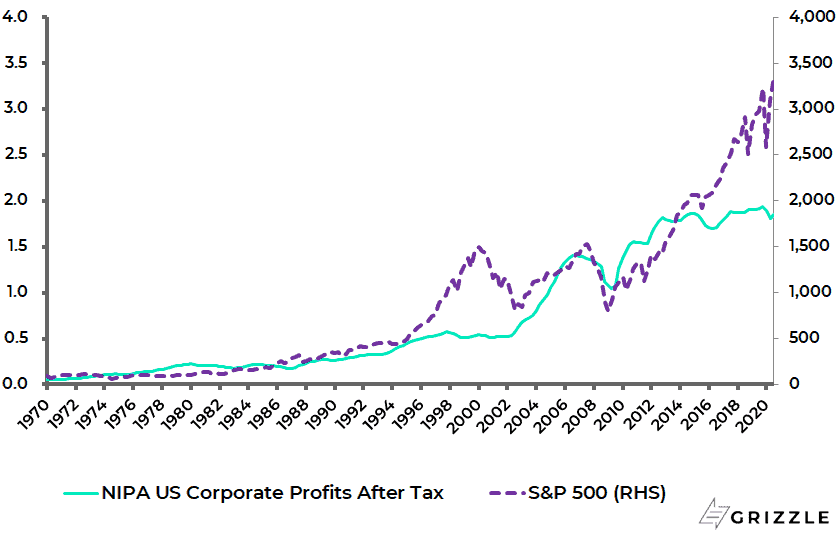
By contrast, corporate profits after tax rose by an annualised 0.4% in the three years to 1Q00, while the S&P500 was up 98% over the same period.
The economic downturn is not going to happen in this writer’s view since the vaccine rollout implies the opposite and the resulting unleashing of massive pent-up demand, which will only be given further momentum by the sheer scale of the coming up to US$1.9tn Covid stimulus proposed by the Biden administration.
As for monetary tightening, it is important to remember that the bursting of the 2000 Internet bubble followed Fed tightening.
The Fed raised the Fed funds rate by 175bp from 4.75% in June 1999 to 6.5% in May 2000.
There is no doubt that how the Fed responds to the evidence of accelerating cyclical recovery remains the critical issue for financial markets in 2021, as discussed here previously (Coming to America – Yield curve control, 10 February 2021).
So far Federal Reserve chairman Jerome Powell has sought to downplay tapering expectations.
Still, with inflation expectations continuing to rise and the US bond market continuing to sell off, the markets will be hyper focused on Fed communications.
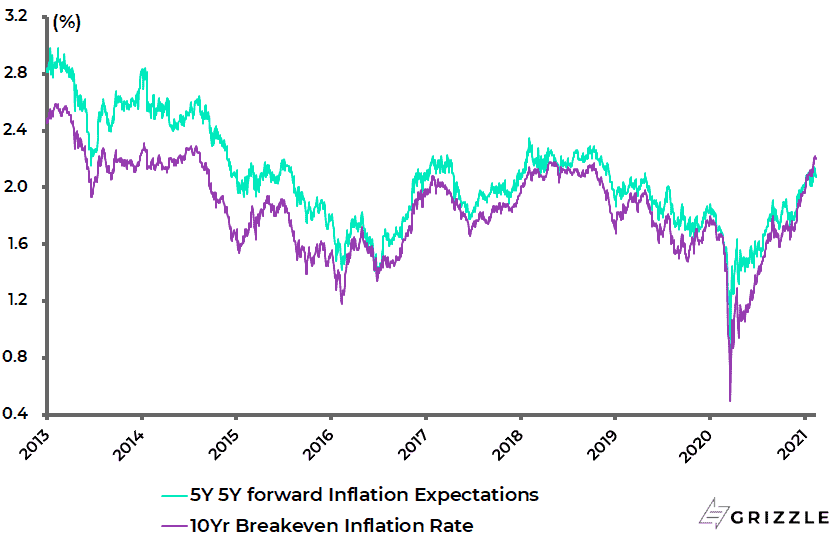
The US 5-year 5-year forward inflation expectations rate rose from 1.72% in early November to 2.14% on 5 February, the highest level since December 2018, though it has since declined to 1.99%.
Similarly, the US 10-year breakeven inflation rate rose from 1.64% in early November to 2.24% on 16 February, the highest level since August 2014, and is now 2.14%.
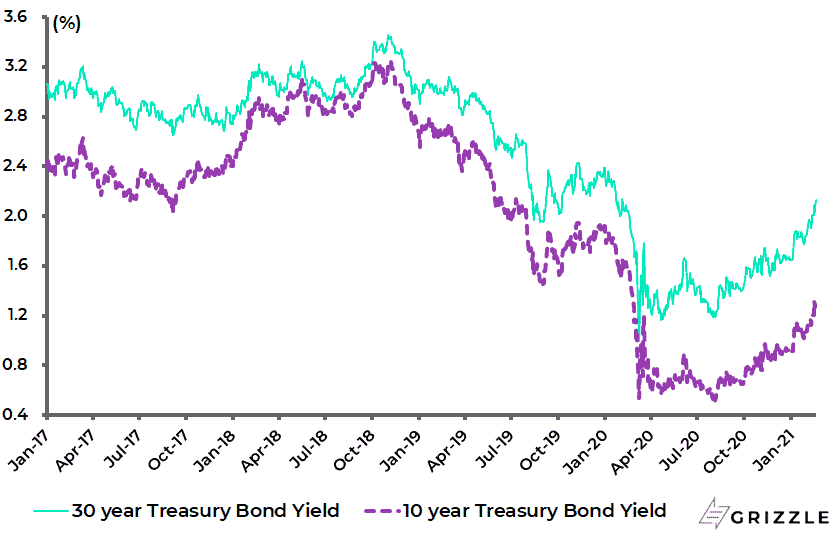
As for the bond market, the US 10-year and 30-year Treasury bond yields have risen by 42bp and 49bp respectively so far in 2021 to 1.34% and 2.13%, the highest levels since February 2020.
US Treasury Bond Yields
With inflation expectations and bond yields rising of late, comments attributed to Fed Vice Chairman Richard Clarida at a Hoover Institution event in January are interesting.
This is because Clarida focused in part on the critical area for the Fed of inflation expectations data.
US Inflation Expectations
Clarida stated in the speech that the Fed will not only be looking at market-based indicators of inflation expectations, which can be volatile, but also at other measures such as surveys as well as the Fed staff’s “index of common inflation expectations” which is comprised of 21 inflation expectation indicators including surveys and financial instruments (see “Fed Notes: Index of Common Inflation Expectations”, by Fed economists Hie Joo Ahn and Chad Fulton, 2 September 2020).
The problem here is that the Fed does not publish updates on such data. Indeed the data was only last published in a Fed note in September, with only 1Q20 data provided.
All this suggests that the still deflation obsessed Fed will want to see a lot more evidence of inflationary pressures than in past cycles, which means that the base case remains that monetary policy can remain easier for longer given the Fed’s obsession with not tightening prematurely and thereby risk not securing its 2% inflation target.
It also remains the case that Fed governors remain deliberately vague about how much and for how long they are willing to overshoot the 2% target, presumably to give themselves maximum flexibility.
The Market Could Force The Fed’s Hand
Still, even the best-laid plans can be undermined by market action.
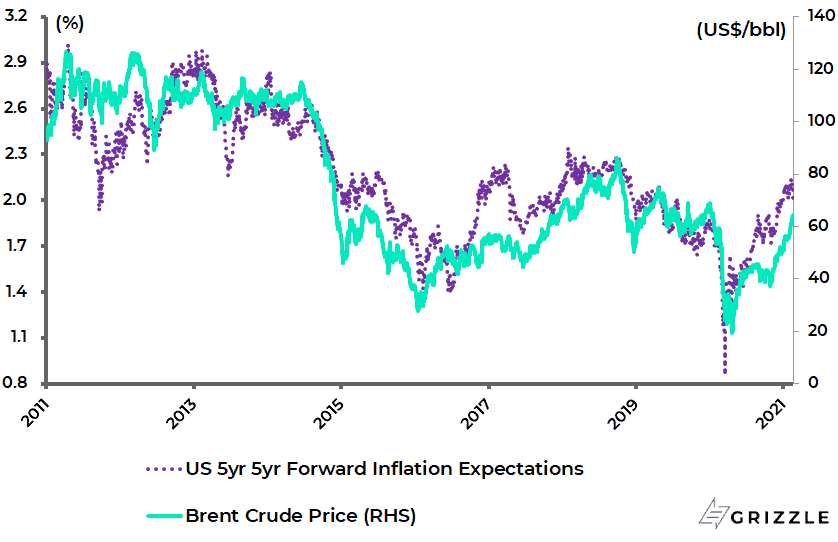
And in this respect, market-driven inflation expectations can indeed be very volatile, as can be seen in their historic correlation to the oil price.
And the oil price is now rising, along with the prices of many other commodities.
The correlation between the Brent crude oil price and the US 5-year 5-year forward inflation expectation rate has been 0.90 since 2011.
Brent Crude Oil Price and US 5Y 5Y Forward Inflation Expectation Rate
The views expressed in Chris Wood’s column on Grizzle reflect Chris Wood’s personal opinion only, and they have not been reviewed or endorsed by Jefferies. The information in the column has not been reviewed or verified by Jefferies. None of Jefferies, its affiliates or employees, directors or officers shall have any liability whatsoever in connection with the content published on this website.
The opinions provided in this article are those of the author and do not constitute investment advice. Readers should assume that the author and/or employees of Grizzle hold positions in the company or companies mentioned in the article. For more information, please see our Content Disclaimer.