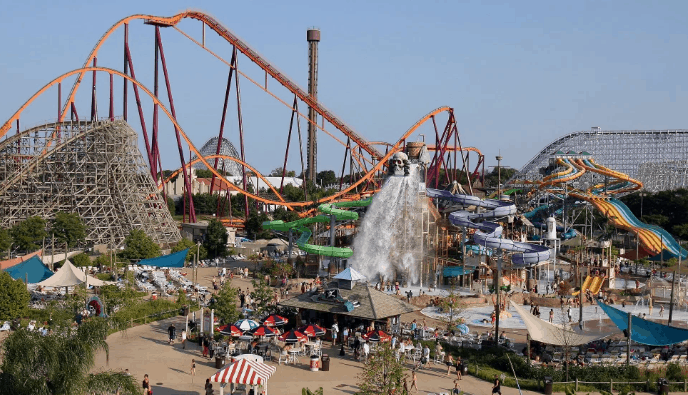
Six Flags Entertainment Corp. (NYSE:SIX) announced their second quarter fiscal 2020 earnings today that disappointed street consensus, causing shares to trade lower pre market.
The world’s largest regional theme park company, and the largest operator of waterparks in North America generated $19.14M of revenue in the second quarter, well below analyst estimates by 63.4%
Due to the suspension of its North American operations since March 13, 2020 because of the pandemic, guest attendance was down by 96% since the same period of last year.
The company’s earnings per share came in at ($1.62)/sh, below analyst expectations of ($0.99)/sh.
EBITDA for the reported quarter was ($112.07)M, which was much lower than analyst estimates of ($44.05)M by 154.4%
Industry Valuation
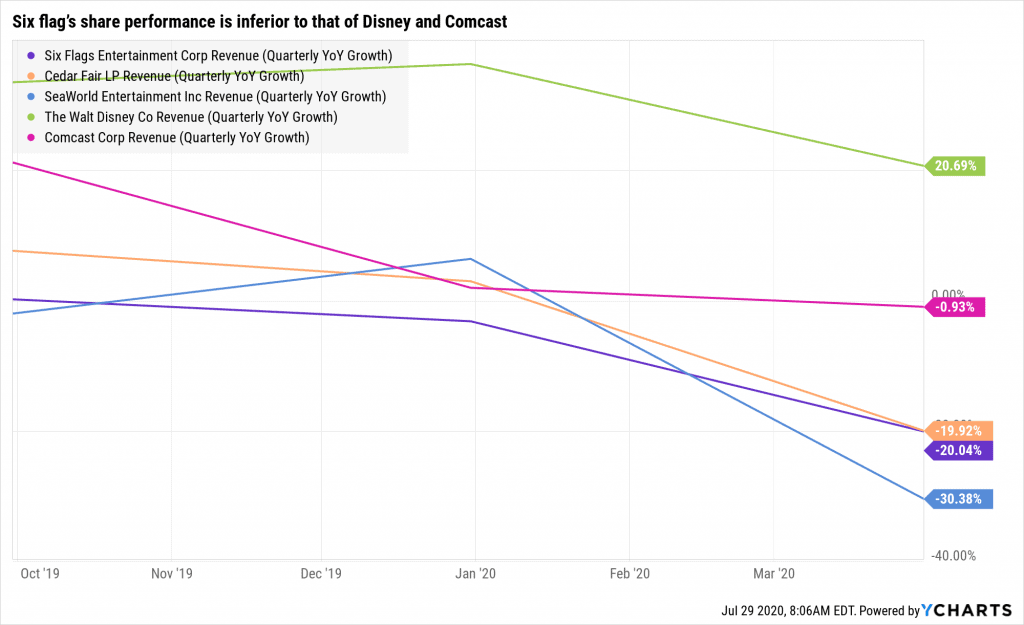
It is no surprise that the current pandemic lockdown has decimated its operations the most along with their closer competitors: Cedar Fair, and SeaWorld.
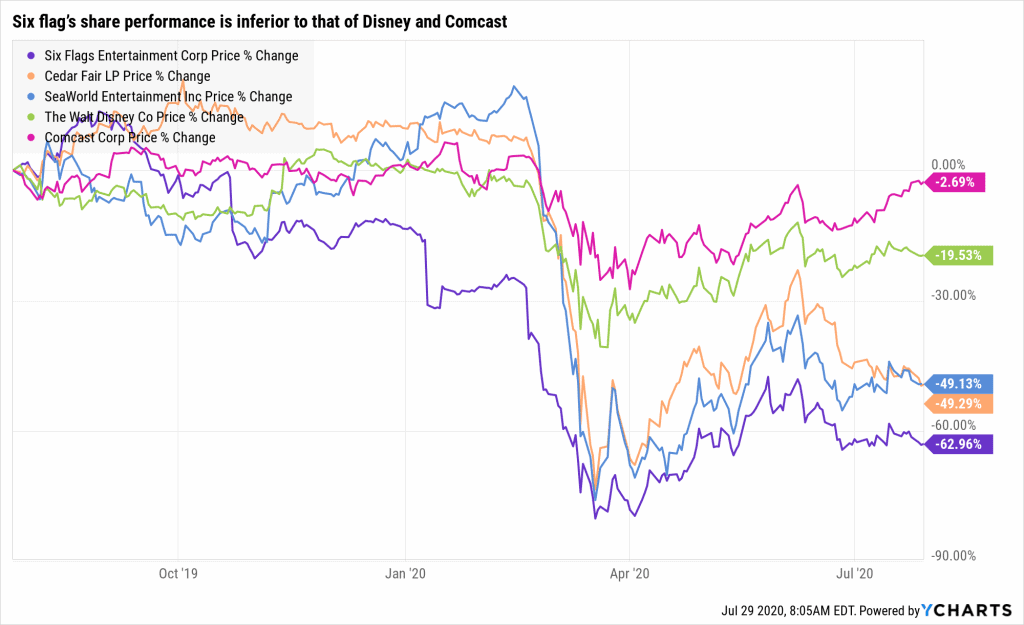
Six Flags’ primary sources of revenue are from park attendance, food/merchandise sales, and sponsorships. This revenue model is very similar to that of Cedar Fair, and SeaWorld too.
In contrast, Disney and Universal Parks & Resorts owner Comcast enjoys more diversified revenue streams, which gives them more flexibility during the pandemic.
Disney’s recent move into the streaming space with the launch of Disney+ prior to the pandemic, could not have come at a better time. By having a vast catalogue of classic Disney TV shows and movies, including the recent addition of the play Hamilton, Disney is able to generate pandemic proof cash inflow from their subscribers.
Similar to Disney, Comcast which owns controlling stakes in NBCUniversal and Sky Broadcasting to name a few, is also a media giant as well.
As a result, as shown below the revenue performance of Six Flags and its closer competitors are worse off than Disney and Comcast.
Cash Position is Solid but is There any Value Left after COVID-19
Even though debt levels are up 18% since last quarter to $2.6B, Six Flags has strong liquidity to ride out the pandemic.
Management estimates the cash burn will be $90 million a quarter at most through the rest of the year.
With ~$300 million of cash and $460 million of borrowing available, this gives the company 3-8 months of cash left, more than enough based on the current timelines of a vaccine by the first quarter of 2021.
The big question is will there be any value left for stockholders once the dust has settled?
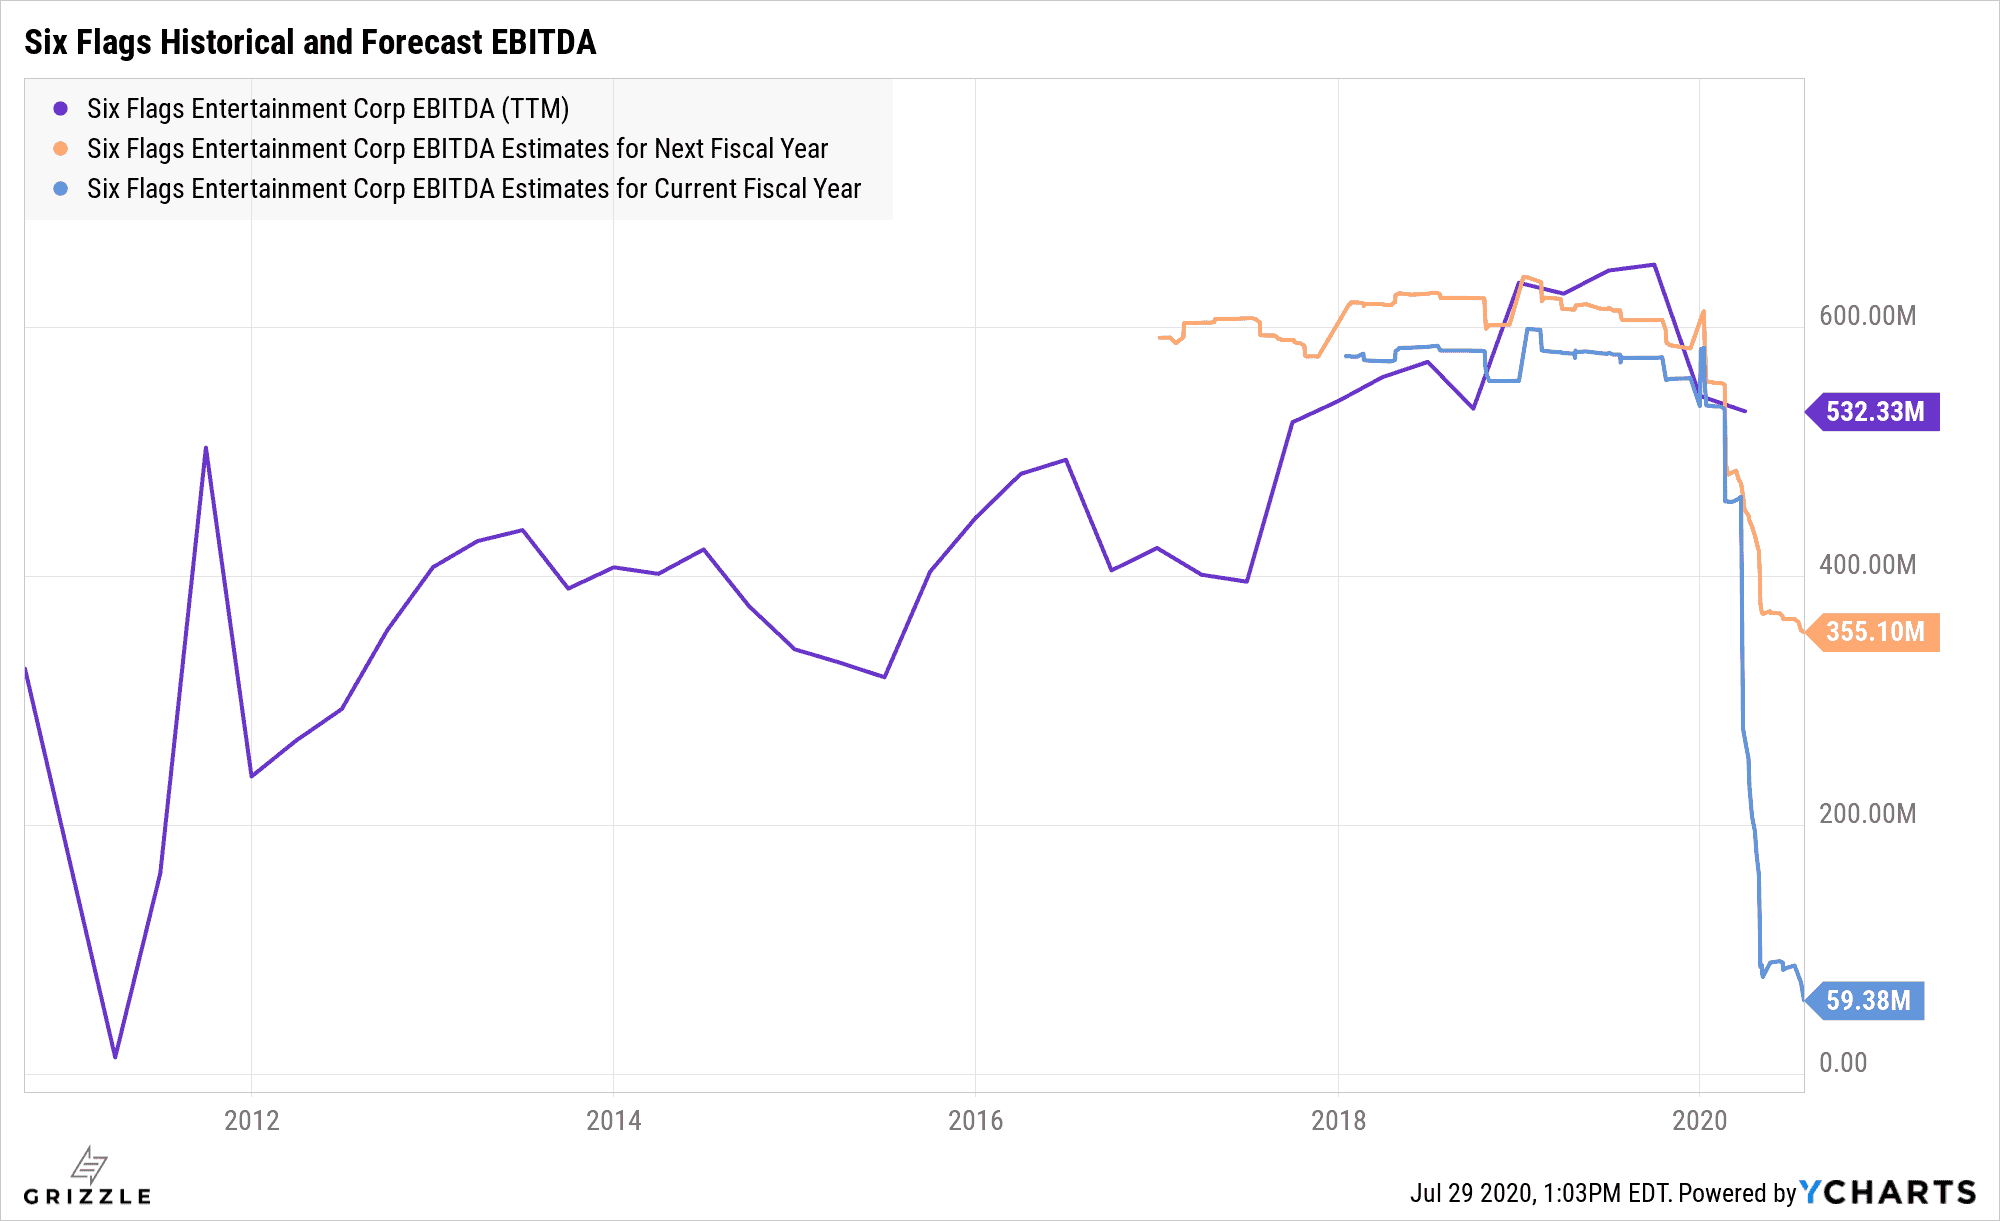
Historically Six Flags has generated between $300-$600 million of EBITDA depending on where we are in the cycle.
While the pandemic is going on EBITDA is negative so the estimate of $355 million for 2021 is too high in our view and 2022 will probably be closer to $300-$400 million, in line with the early years of an economic recovery.
Historically the market is willing to pay 8x EBITDA in the early innings of a recovery and up to 13.5x near the end of a bull market.
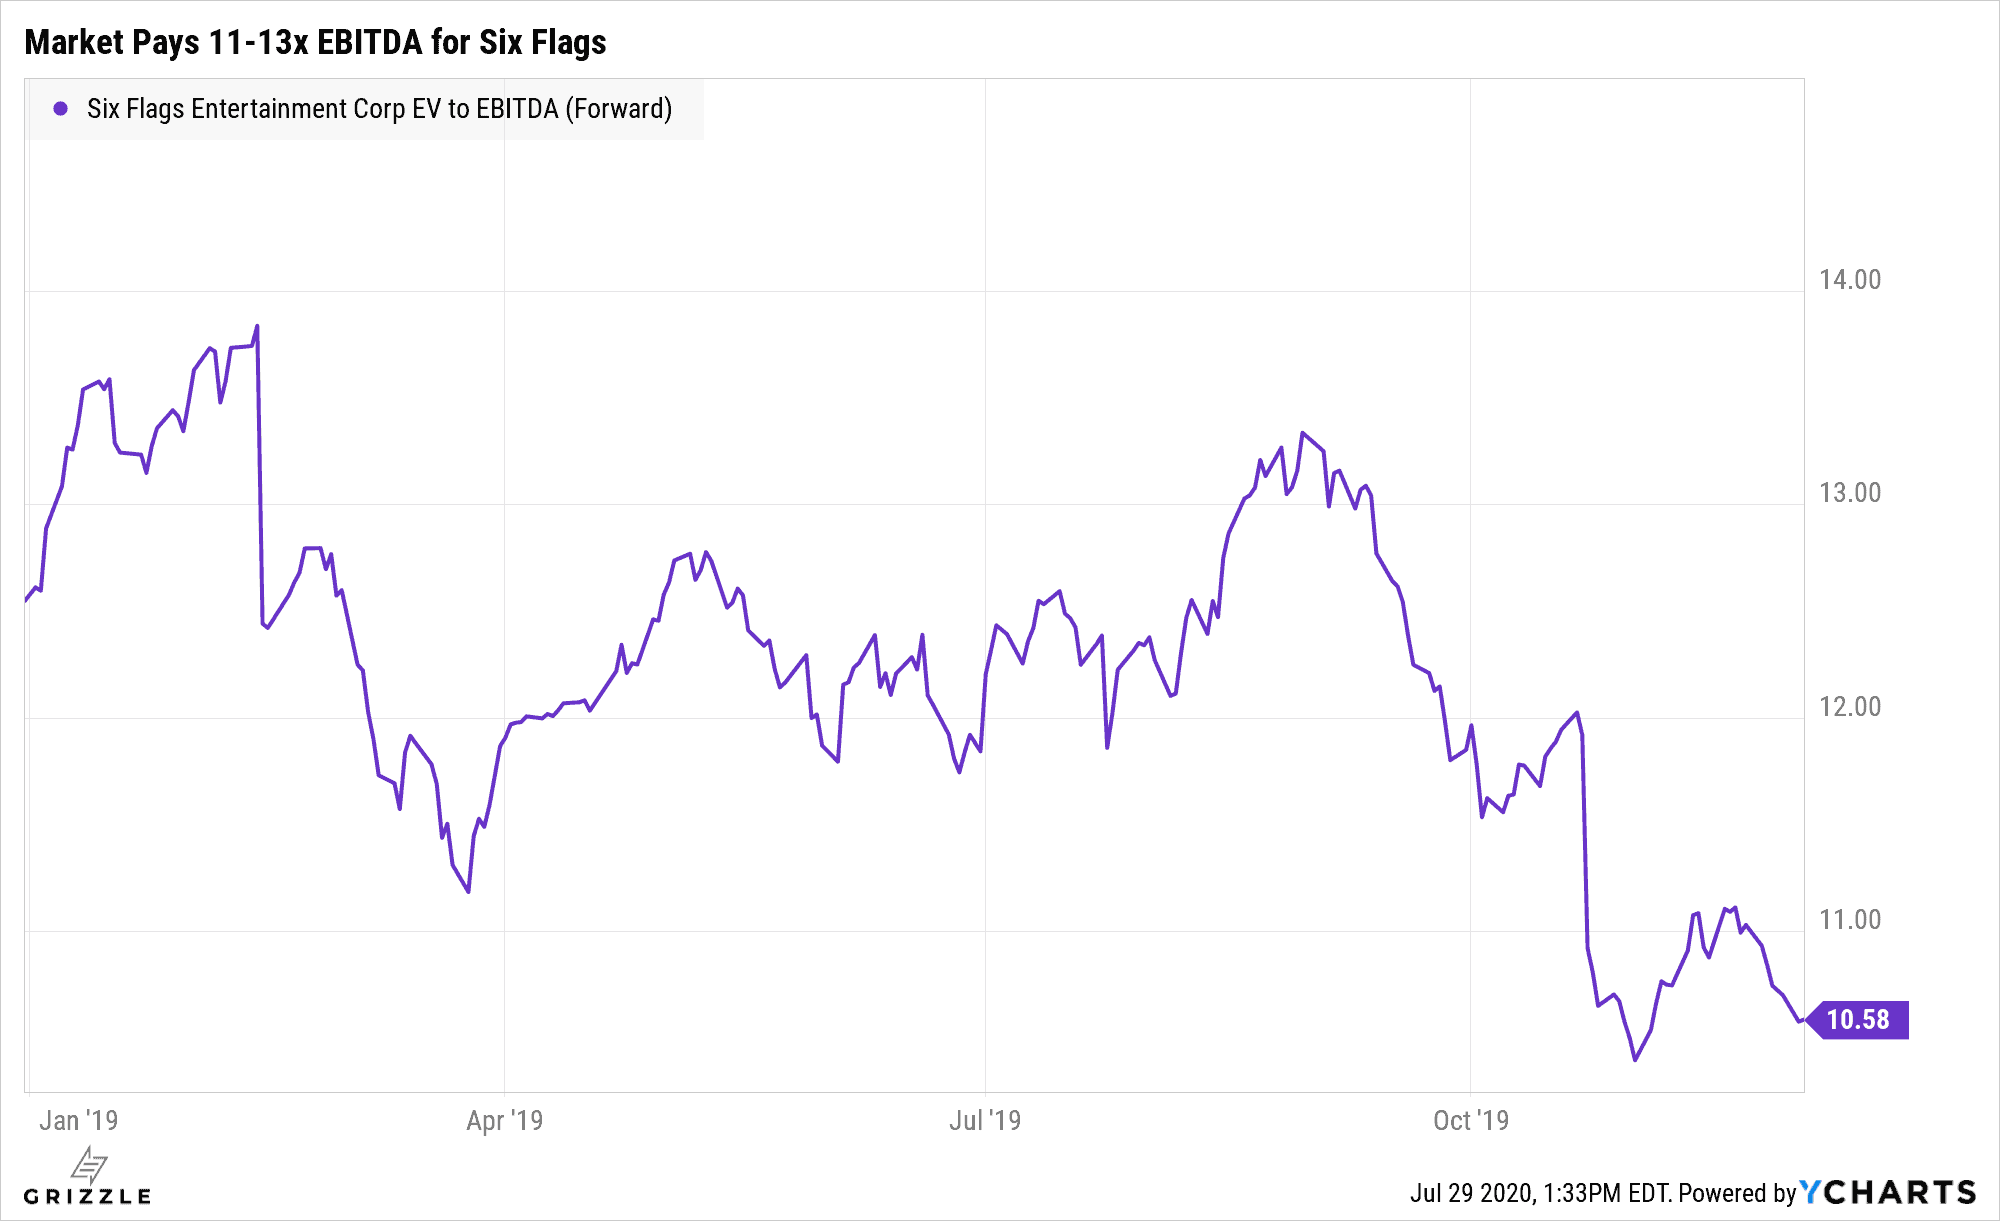
So if we assume post-COVID-19 Six Flags can generate $400 million of EBITDA and trades at 8x-13.5x that EBITDA, the stock has potentially a lot of downside to it as well as some upside.
Say we think either scenario has a 50% chance, then the stock is worth $14.40/sh, 22% down from here.
Potential Six Flags Share Price in Late 2021
| $ Millions except ratios | 8x EBITDA | 13.5x EBITDA |
| EBITDA (2022E) | 400 | 400 |
| EV/EBITDA Multiple | 8x | 14x |
| Enterprise Value | 3,200 | 5,400 |
| (-) Less Net Debt | 3,079 | 3,079 |
| Market Cap | 121 | 2,321 |
| Shares Outstanding | 85 | 85 |
| 2022 Stock Price | $1.42 | $27.31 |
| Current Stock Price | $18.41 | $18.41 |
| (Downside)/Upside | -92% | 48% |
Source: Grizzle Estimates, http://www.ycharts.com
Full Disclosure: The author has no positions in any of the securities mentioned in this report.
The opinions provided in this article are those of the author and do not constitute investment advice. Readers should assume that the author and/or employees of Grizzle hold positions in the company or companies mentioned in the article. For more information, please see our Content Disclaimer.