Powell Leaves Wiggle Room for Negative Rates
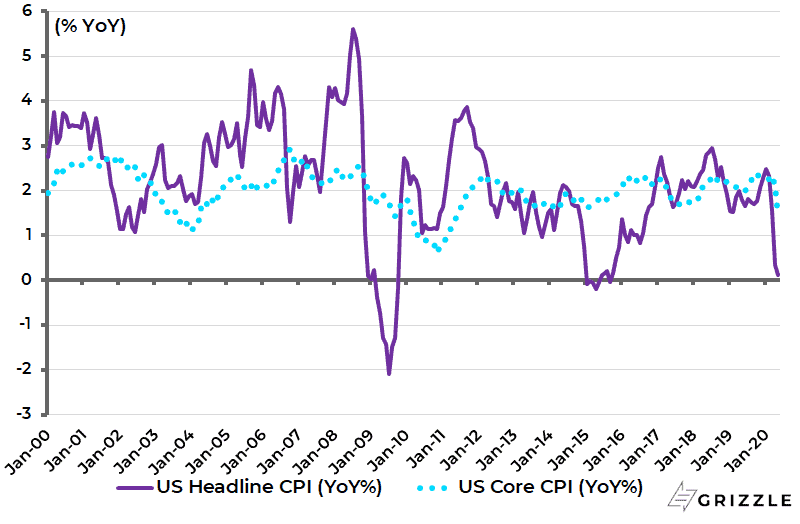
CPI inflation in the US has not yet turned negative on a year-on-year basis which is the sort of trigger that is likely to get the money markets pricing negative rates again, most particularly in the context of continuing fears about renewed second waves.
Still, while declining MoM for three straight months (including May), US headline and core CPI inflation slowed from 0.3% YoY and 1.4% YoY respectively in April to 0.1% YoY and 1.2% YoY in May (see following chart). It should be remembered that Fed chairman Pivot Powell has now left a crack in the window for negative rates.
Thus, Powell said at the Peterson Institute for International Economics in May that “for now it’s not something that we’re considering”. And Powell’s track record strongly suggests that he can be mugged by the markets into doing things he previously said he did not want to do. As for inflation expectations, the 5-year 5-year forward inflation expectation rate has risen from a low of 0.86% in mid-March to 1.61% (see following chart).
US CPI inflation
Source: Bureau of Labor Statistics
US 5-year 5-year forward inflation expectations

Source: Federal Reserve Bank of St. Louis
COVID-19 – The Divergence between Cases and Deaths
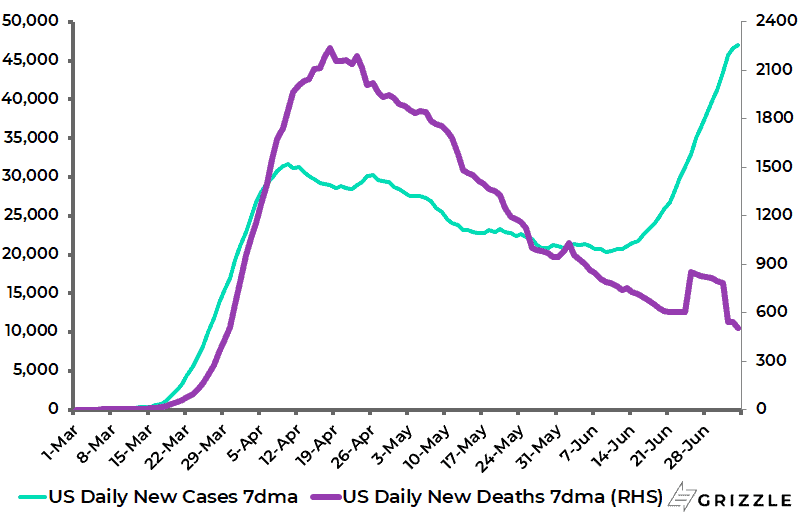
Meanwhile, the key short-term issue for financial markets remains the same as it was last week. That is the growing divergence in America between cases and deaths.
The 7-day average daily new cases in America have risen by 123% since the end of May, while average daily deaths have declined by 46% over the same period and are now down 77% from the peak reached in April (see following chart).
US Covid-19 daily new cases and deaths (7-day mov. avg.)
Source: Johns Hopkins University
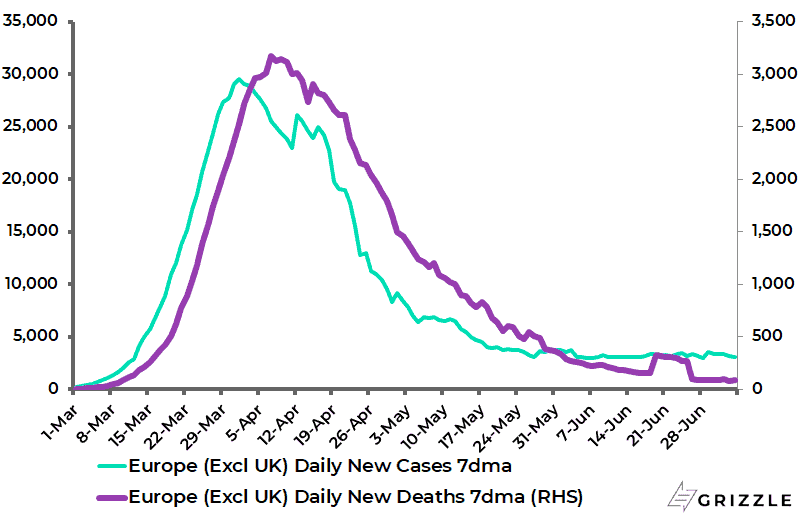
What is very clear is that Europe, excluding the UK, continues to look far more promising as regards managing Covid-19 and it is now, in the case of the largest economy Germany, 11 weeks into a gradual reopening.
The number of daily new cases and deaths in Europe excluding UK, on a 7-day rolling average basis, has declined by 90% and 97% respectively from the April peak (see following chart).
Europe, excl. UK, Covid-19 daily new cases and deaths (7-day mov. avg.)
Source: Johns Hopkins University
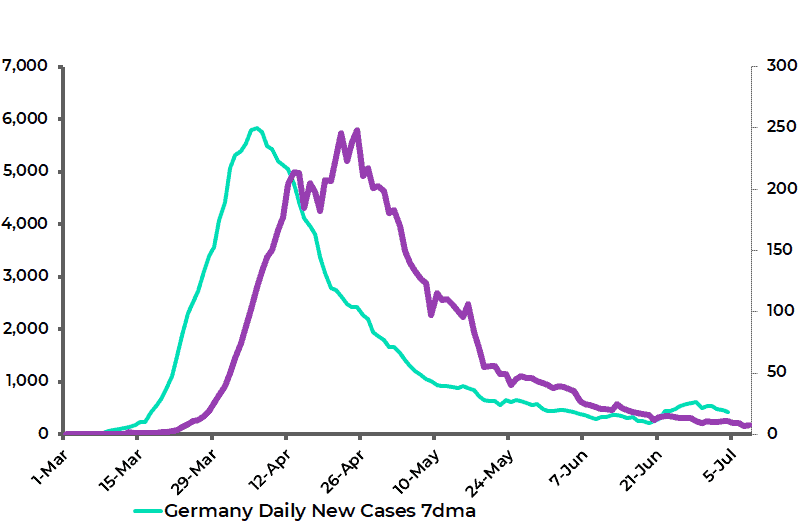
In Germany, new cases and deaths are down 93% and 97% respectively from the peak in April (see following chart). This is about as good as could reasonably be expected.
Germany Covid-19 daily new cases and deaths (7-day mov. avg.)
Source: Johns Hopkins University
Source: Johns Hopkins University
European Equities are the Cyclical Trade
In this respect, the cyclical trade has, for now, much more fundamental support in European equities than American equities. It is also the case that the benchmark index, MSCI Europe, is much more dominated by cyclicals.
The materials, consumer discretionary, financials, real estate and industrial sectors account for 48% of the MSCI Europe, compared with 36% for the MSCI USA.
From a monetary policy perspective, the ECB has also done its predictable part by recently making sure that its expanded quantitative easing programme slightly exceeded already robust market expectations.
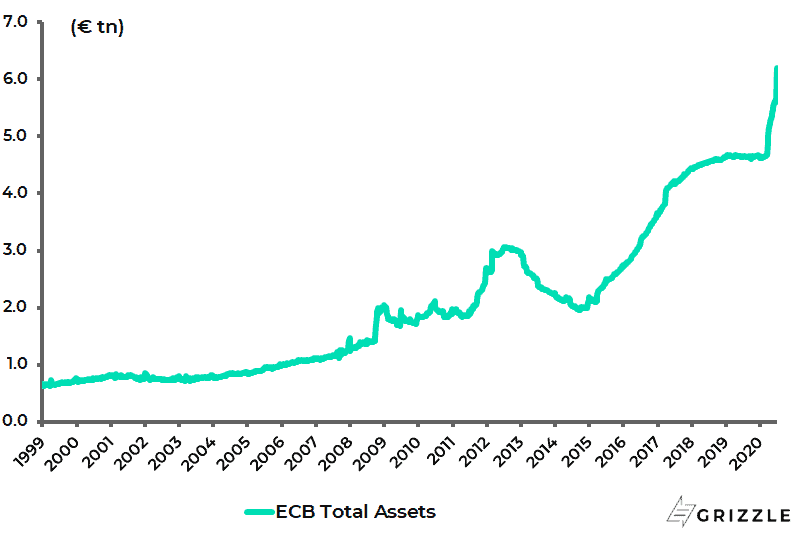
The ECB announced in early June an increase in its so-called pandemic emergency purchase programme (PEPP) by €600bn to €1.35tn, with the horizon for such net purchases extended to at least the end of June 2021. The ECB balance sheet is likely to reach €7tn by the end of this year.
ECB balance sheet
Source: ECB
A further positive in the Eurozone will be the anticipated formal confirmation later this month of the final details of the €750bn Economic Recovery Fund. This is likely to be a mixture of grants and loans and will be probably viewed by the markets as an incremental move towards fiscal union or backdoor Eurobonds.
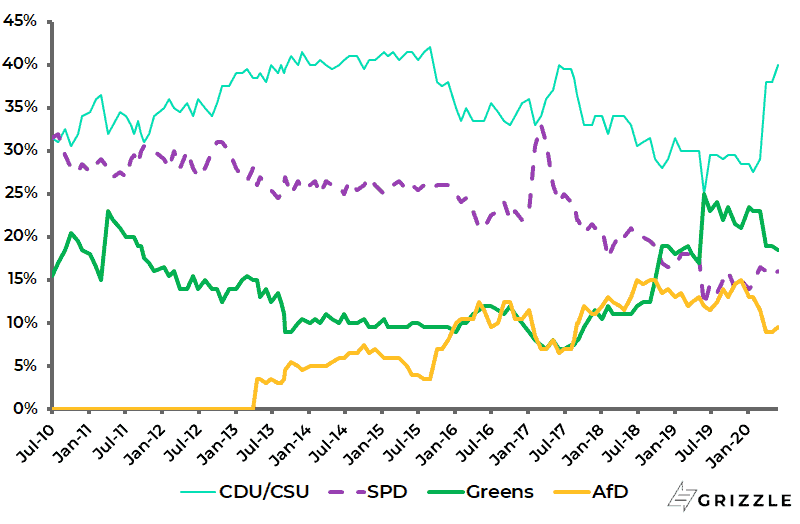
This has been made possible by German Chancellor Frau Merkel’s support for the proposal over the objections of other northern Europeans led by the Dutch. Merkel’s party the CDU has risen in popularity because of its perceived success in combating the pandemic (see following chart). This has had the practical consequence of making it easier for her to support French President Emanuel Macron’s desire to move towards greater fiscal integration.
Germany opinion polls (party supports)
Source: Allensbach Institute
There was also a better than expected take-up, namely €1.3tn, of the latest gift by the ECB to the banks, namely the fourth operation of the so-called TLTRO-III. This allows European banks to borrow from the ECB at a negative rate of -100bp for the period from June 2020 to June 2021, and at the average deposit facility rate (currently -50bp) for the rest of the life of the TLRO-III operation, providing they meet certain criteria.
Japan Also Cyclically Leveraged
If European equities are naturally geared to cyclical recovery hopes, most particularly if there is also a growing fiscal integration story to celebrate, there is another major stock market globally which is also much more cyclically geared than America’s. That is Japan.
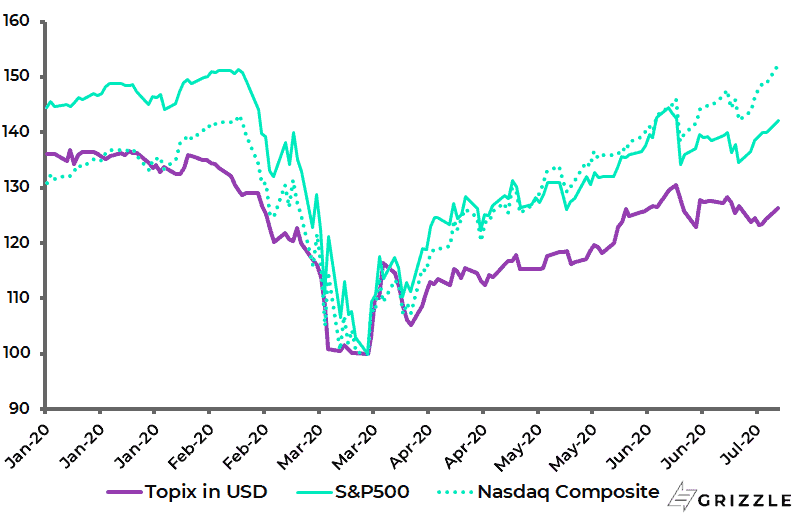
The materials, industrials, consumer discretionary, financials and real estate sectors account for 57% of the MSCI Japan. In this respect, the Topix has been a laggard in the rally off the March low relative to the bullish action in the S&P500. Thus, the Topix has risen by 24% in US dollar terms since bottoming in March, while the S&P500 is up 40% and the Nasdaq up 49% from its March low (see following chart).
Topix in US dollar terms vs S&P500 and Nasdaq
Source: Bloomberg
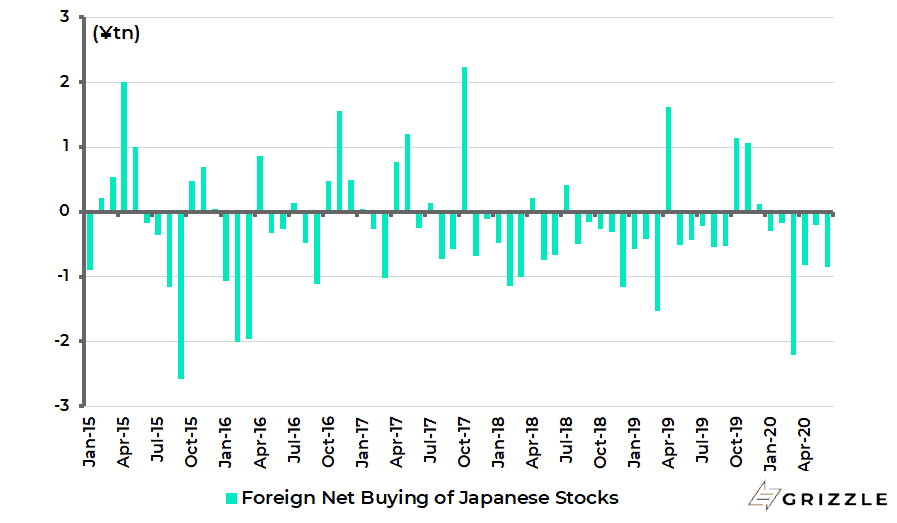
Foreigners have also remained net sellers of Japanese equities last quarter, which is surprising given the cyclical rally. Foreigners sold a net Y1.85tn worth of Japanese stocks last quarter, after selling a net Y2.65tn in 1Q20 (see following chart).
Foreign net buying of Japanese stocks
Source: Bloomberg, Japan Exchange Group
Gold is the Best Hedge vs. Cyclical Equity Exposure
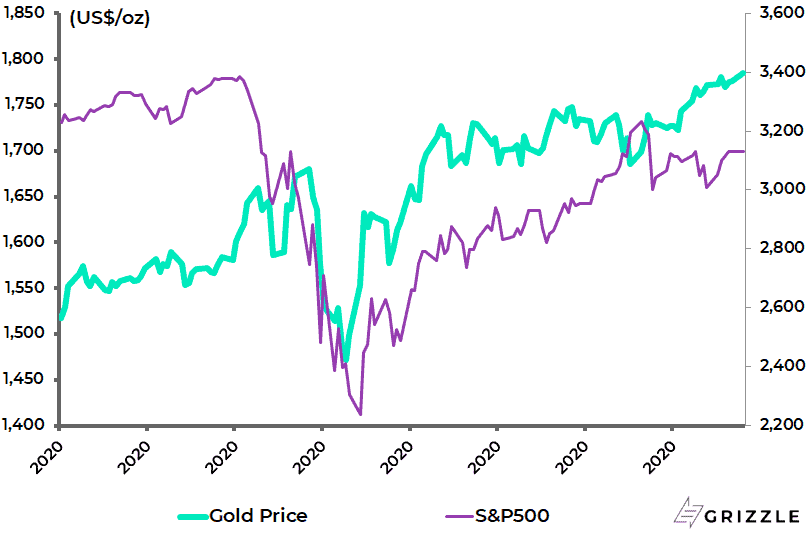
Meanwhile, the best hedge on owning cyclical stock markets like Europe and Japan geared to the reopening trade remains gold. This is because gold should soar if there is a renewed spike, since this will fast forward expectations of even more monetary stimulus and even possibly negative rates, courtesy of Powell. In this respect, gold has remained remarkably resilient in the context of last quarter’s stock market rally, having risen by 20% from its March low (see following chart).
Gold bullion price and S&P500
Source: Bloomberg
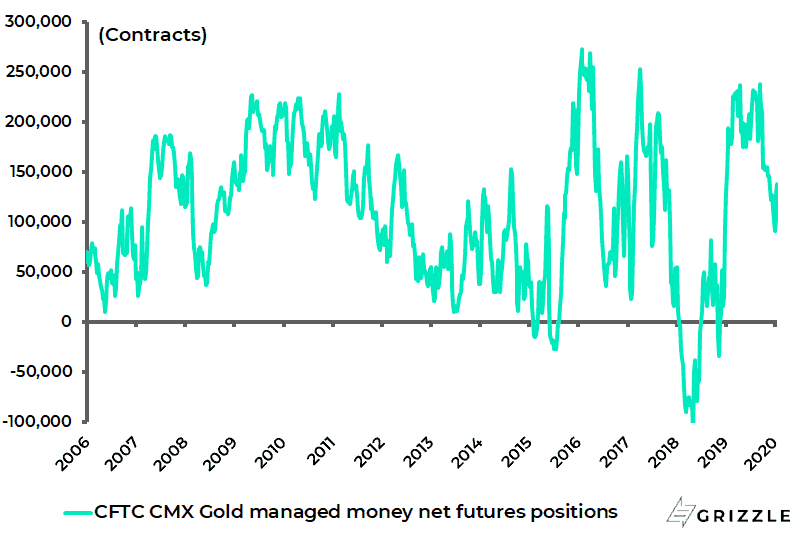
Meanwhile money managers’ US gold futures net long positions have declined by 62% from a recent high of 238,546 contracts reached in mid-February to 91,177 contracts in the week ended 9 June, though they have since risen to 129,515 contracts in the week ended 23 June (see following chart).
Comex gold managed money net futures positions
Source: Commodity Futures Trading Commission (CFTC), Bloomberg
About Author
The views expressed in Chris Wood’s column on Grizzle reflect Chris Wood’s personal opinion only, and they have not been reviewed or endorsed by Jefferies. The information in the column has not been reviewed or verified by Jefferies. None of Jefferies, its affiliates or employees, directors or officers shall have any liability whatsoever in connection with the content published on this website.
The opinions provided in this article are those of the author and do not constitute investment advice. Readers should assume that the author and/or employees of Grizzle hold positions in the company or companies mentioned in the article. For more information, please see our Content Disclaimer.
