The cyclical rebound in America should continue to surprise on the upside in terms of the pent-up demand potential, a view which has been boosted by the US$1.9tn Covid stimulus in March and a pending US$2.25tn infrastructure stimulus.
Economists’ stampede to upgrade US economic forecasts in recent months reflects the growing realisation that this has been no ordinary downturn in the sense that it has been a supply shock mandated by governments.
There is, therefore, no reason why the private sector’s risk appetite should be dramatically diminished assuming the American economy reopens fully in coming months, and it has already opened to a significant extent.
This dynamic is particularly pronounced in the case of households as a result of the massive increases in transfer payments.
Indeed the interesting point is that US households seem to have been net financial beneficiaries of the pandemic. US households had, prior to the latest Covid stimulus, lost US$530bn in income and received US$1.35tn in transfers, based on data from the Bureau of Economic Analysis.
This is measured by comparing the average income/transfers over the 12 months to February 2021 with the pre-Covid level in February 2020.
Thus, compensation and other personal income, excluding transfer payments, averaged an annualised US$16.84tn in the twelve months to February, compared with US$17.37tn in February 2020.
US Personal Income and Savings
| US$bn, saar | Feb-20 (Pre-Covid) |
Mar20 – Feb21 (Average) |
Chg vs Feb-20 |
| Personal income (excl. transfers) | 17,373 | 16,843 | (530) |
| Personal current transfer receipts | 3,211 | 4,565 | 1,354 |
| Disposable personal income | 16,831 | 17,774 | 943 |
| Personal outlays | 15,442 | 14,630 | (812) |
| Personal saving | 1,389 | 3,143 | 1,755 |
| Personal saving/disposable income (%) | 8.3 | 17.7 | 9.4 |
Note: Personal income includes compensation of employees, proprietors’ income, rental income, interest and dividend incomes. Source: Bureau of Economic Analysis
As a consequence, US personal savings have increased by US$1.75tn over the same period.
Meanwhile, Americans earning below US$75,000 will now receive another US$1,400 stimulus cheque (or couples earning up to US$150,000 will receive US$2,800), totaling an estimated US$422bn; as a consequence of the latest US$1.9tn stimulus.
As a result, US households have been sitting on excess savings of US$2.2tn as at the end of the last quarter.
The savings rate in America was already a very elevated 13.6% of disposable income in February and averaged 17.7% over the 12 months to February.
US personal Savings as % of Disposable Income
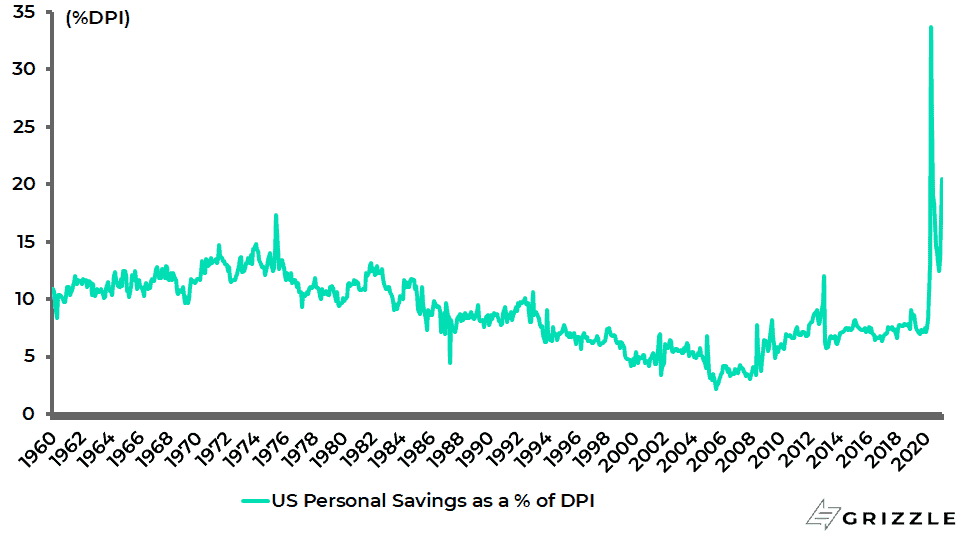
Source: US Bureau of Economic Analysis
Source: US Bureau of Economic Analysis
Another way of looking at the same phenomenon is the surge in American household deposits. US household deposits rose by 22.9% YoY to US$14.1tn at the end of 4Q20.
US Household Deposits
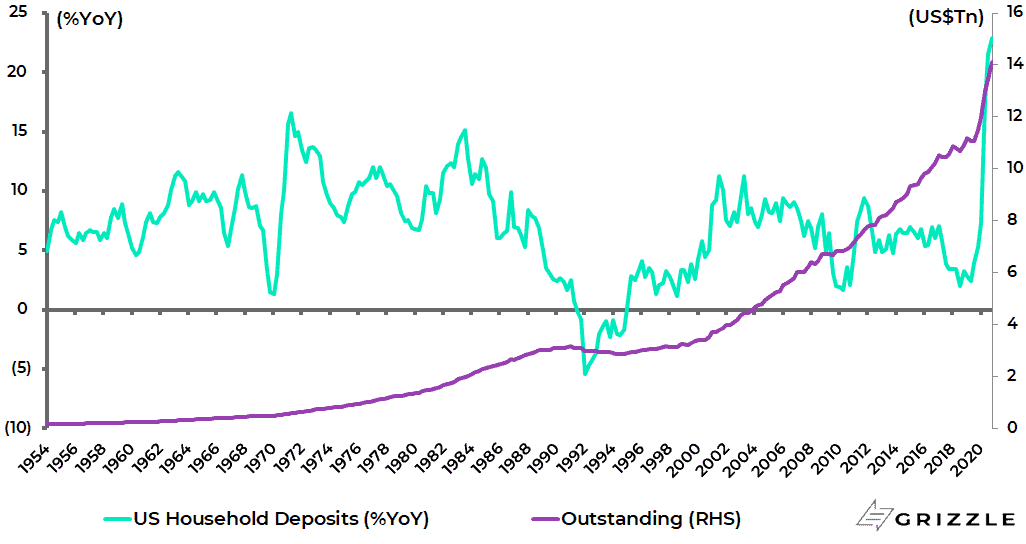
Source: Federal Reserve – Financial Accounts of the United States
This is Not a Normal Financial Crisis
All of the above creates a dynamic where the base case remains that much of this money will be spent, as the psychological relief coming out of the pandemic as the vaccine rollout proceeds, triggers massive pent-up demand.
145m Americans, or 43.6% of the population, have now received at least one dose of the vaccine, with 101m or 30.5% of the population fully vaccinated.
This is, therefore, an entirely different situation than what prevailed after the global financial crisis when American households deleveraged as their main asset, namely their house, collapsed in price.
On this occasion, house prices have of late been surging.
If there is a risk to this optimistic view, it is that American household savings appear to be very concentrated in the wealthier part of the population.
Using the annual data from the Bureau of Labor Statistics’ Consumer Expenditure Survey, the savings rate, measured as the difference between average annual income after taxes and average annual expenditures as a percentage of income after taxes, was 30% in 2019 for the highest income quintile of Americans, compared with a negative 134% for the lowest income quintile.
Or, in other words, the worse off spend more money than they earn.
Still, those without savings, in this writer’s view, are also likely to spend a lot of the money they will now receive.
US Savings Rate by Income Quintile (calculated based on BLS’ Consumer Expenditure Survey)
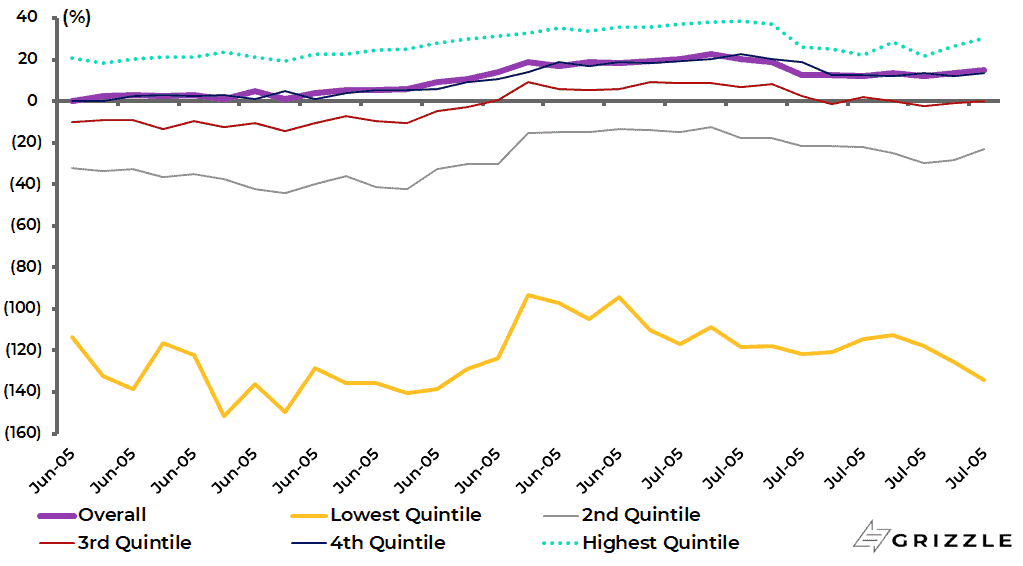
Note: US savings rate = (average annual income after taxes – average annual expenditure) / average annual income after taxes. Source: Bureau of Labor Statistics – Consumer Expenditure Survey
A Big Inflation Scare is Coming
Meanwhile a sudden surge in demand, in an economy which has been hit by a supply shock, is a classic recipe for a pickup in inflation.
And it remains the case that the pickup in inflation is likely to be more than just the year-on-year base effect acknowledged by the Fed, which should see core PCE inflation above the 2% target in the April data.
This is the context in which to view the sell-off in the Treasury bond market last quarter.
Still, bonds need to sell off a lot more before the thesis of a change in investment regime from a deflationary era to an inflationary era can be proven.
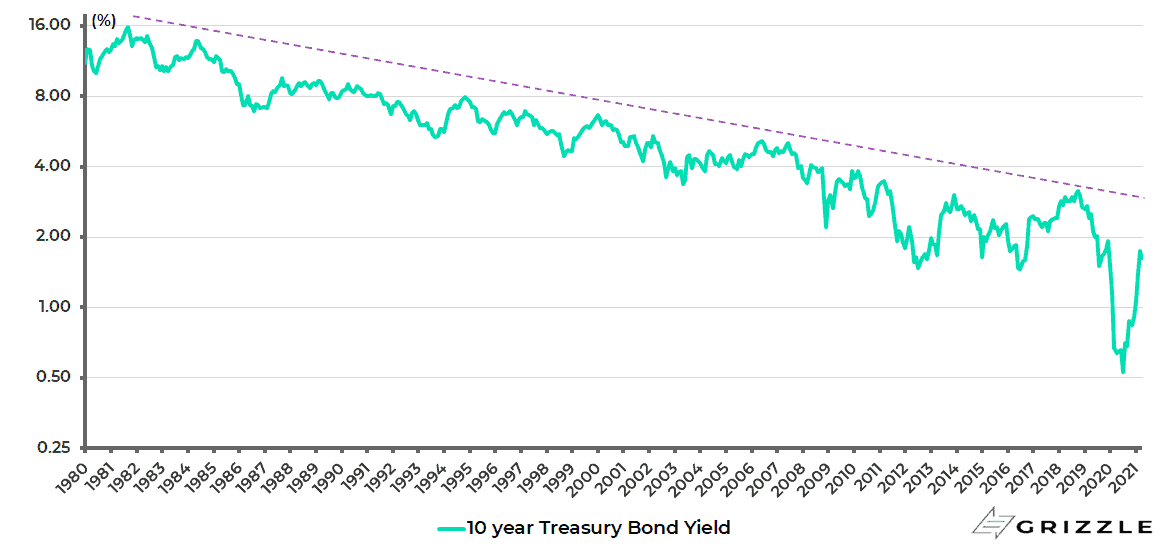
This is because the trend line in place on the 10-year Treasury since the 10-year yield peaked at 15.8% back in 1981 is now at around 2.9%, which is still 116bp above the level the 10-year Treasury closed last quarter.
It should be noted that the 10-year Treasury tested this trend line most recently in October 2018 before the deflationary trend resumed, and clearly the long bond trade was given further momentum early last year by the risk aversion triggered by the pandemic with the 10-year yield bottoming at 0.31% in March 2020.
US 10-year Treasury Bond Yield (Monthly Log Scale Chart)
Despite the growing inflation noise, it remains the case that the consensus of economists, influenced doubtless by the Fed’s continuing doveish language, still expects that a tapering announcement will not commence until the end of this year with rate hikes beginning in early 2023 after the tapering process is completed, in terms of the Fed gradually reducing its monthly net purchases (currently running at US$120bn) to zero.
Still, the real issue to this writer is less the economic data than the market action.
For experience has long since demonstrated that the Fed is moved by markets, and not the other way around.
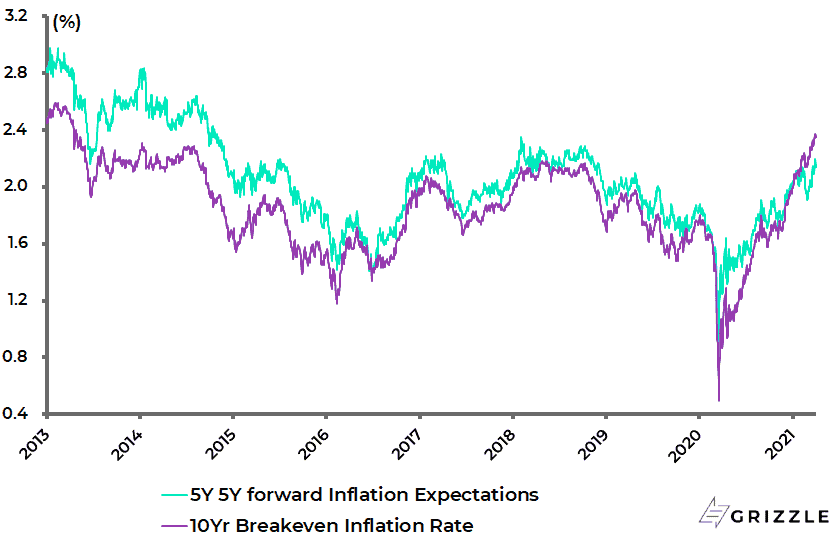
The above is why it remains critical to monitor inflation expectations.
The 10-year breakeven inflation rate rose to 2.42% on 29 April, the highest level since April 2013; while the 5-year forward inflation expectation rate was at 2.28%, its highest level since October 2018.
US Inflation Expectations
Source: Federal Reserve Bank of St. Louis
To be clear, the expectation is for the biggest inflation scare since the early 1980s.
Whether it turns out to be a trend change to higher inflation will depend on how the Fed responds.
But implementation of yield curve control in the US would, if it happens, make the case for a trend change to higher inflation.
Fed is Targeting Employment as Well as Inflation
Meanwhile, the Fed is not only targeting inflation and employment but also inclusive employment.
Consider, for example, a speech made by Fed Governor Lael Brainard in late February which, from a labour market prospective, highlights why the Fed will run things hotter for longer (see Lael Brainard speech via webcast: “How Should We Think about Full Employment in the Federal Reserve’s Dual Mandate?” at the Harvard University’s Ec10 Principles of Economics lecture, 24 February 2021).
This speech goes into a lot of detail in terms of breaking down the overall employment data.
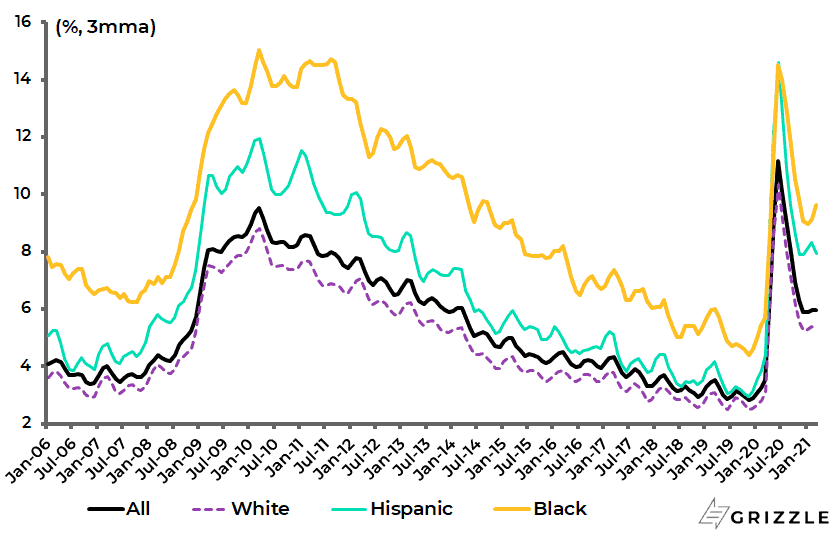
Thus, Brainard stated that workers in the lowest wage quartile faced “Depression-era” rates of unemployment of around 23%.
She also highlighted that, for prime-age (25-54) individuals, the white unemployment rate was roughly four and three percentage points lower than the Black and Hispanic unemployment rates respectively at the time of the speech.
US Prime-Age (25-54 years) Unemployment Rate
Source: US Bureau of Labour Statistics
Brainard concluded by saying that the assessment of “shortfalls from broad-based and inclusive maximum employment” will be a critical guidepost for monetary policy, alongside “indicators of realized and expected inflation”.
Investors should understand that Brainard’s views appear to be mainstream in the context of the Biden administration.
Meanwhile, if the official narrative of why yield curve control has been introduced will be focused on not letting rising long term interest rates destabilise the economic recovery and therefore jeopardise consolidating the Fed’s 2% inflation target, there will be other unspoken motives behind a decision to peg government bond yields.
That is, first, to avoid a fiscal debt trap where higher long-term interest rates would make current levels of government debt and fiscal deficits unsustainable.
And, second, to ensure that nominal interest rates remain below inflation to ensure that the debt is inflated away.
For yield curve control would amount to the conscious suppression of both nominal yields and real interest rates to the detriment of savers.
Or, to put it another way, inflation will rise considerably above the level of nominal interest rates that the system can tolerate.
The Government Can’t Afford Higher Interest Rates
Meanwhile, it should be recalled that the clue as to why yield curve control will become necessary was given, unconsciously, by former Fed chair and now US Treasury Secretary Janet Yellen when she stated in early March, defending the US$1.9tn Covid package, that it made sense to “go big” while interest rates were so low and, therefore, by implication, affordable.
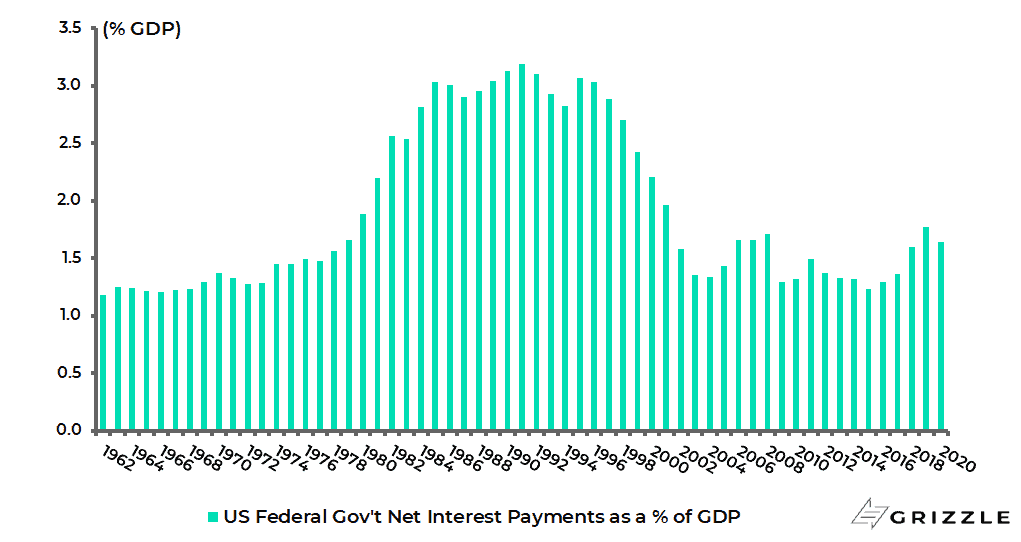
In this respect, the debt servicing costs of funding America’s deficit have collapsed in recent years because of lower Treasury bond yields.
The federal government’s net interest payments have declined from 3.2% of GDP in 1991 to 1.6% of GDP in 2020.
US Federal Government’s Net Interest Payments as % of GDP
Source: Congressional Budget Office
About Author
The views expressed in Chris Wood’s column on Grizzle reflect Chris Wood’s personal opinion only, and they have not been reviewed or endorsed by Jefferies. The information in the column has not been reviewed or verified by Jefferies. None of Jefferies, its affiliates or employees, directors or officers shall have any liability whatsoever in connection with the content published on this website.
The opinions provided in this article are those of the author and do not constitute investment advice. Readers should assume that the author and/or employees of Grizzle hold positions in the company or companies mentioned in the article. For more information, please see our Content Disclaimer.
