The Largest Demographic Cohort
There is an interesting development that has begun of late to get attention in the investment world as it relates to long-term American consumption trends. That is that ‘millennials’, defined as people aged between 17 and 35 (or born from 1982 to 2000), are now larger (85 million) than the baby boomers (73.8 million) defined as those born between 1946 and 1964, according to the U.S. Census Bureau’s population estimates.

Source: U.S. Census Bureau. Annual Estimate of the Resident Population by Single Year, 2015
Non-Tech Millennials Have Been Financially Challenged
This is noteworthy because millennials will undoubtedly have a propensity to consume and, as baby boomers decline in number as the years pass, their importance to the American economy will only grow. Until recently the millennials, save for those who founded successful e-commerce companies or purchased Bitcoin and other cryptocurrencies, have not really had the extra money to spend because it was hard to get a job as a result of the global financial crisis. As a consequence, many over the past decade have stayed in higher education and continued to live at home to save money.
Green Shoots: Homeownership Rate & Labour Force Participation
One result was the sharp decline in the U.S. homeownership rate, a decline which by the way has now seemingly reversed. The seasonally adjusted homeownership rate declined from 69.4% in 2Q04 to 63.1% in 2Q16 and has since risen to 64.0% in 4Q17 (see following chart). Another result was the big increase in student debt. Total student loans outstanding have risen from US$639 billion at the end of 2008 to US$1.36 trillion at the end of 3Q17.
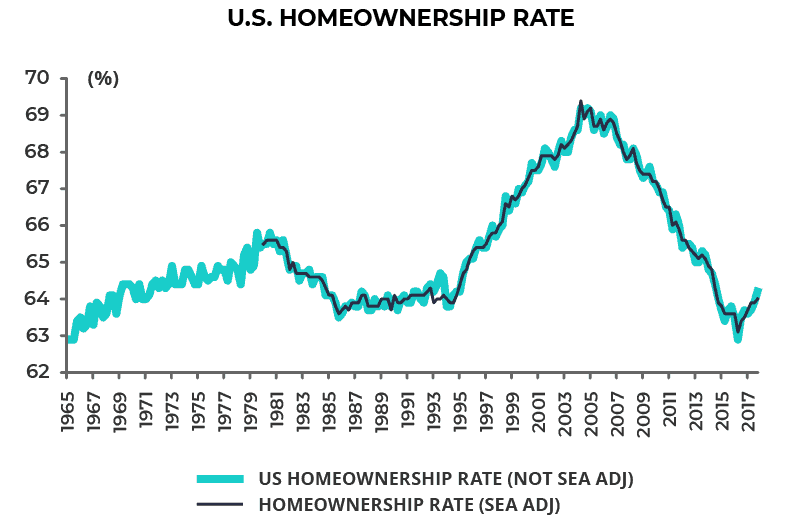
Source: U.S. Census Bureau
A further result has been the sharp decline in the U.S. labour participation rate of young people. But like the homeownership rate, that decline also now seems to be reversing. The labour participation rate for Americans aged between 16 and 24 fell to a 59-year low of 54.1% in February 2014 and is now 54.6% (see following chart).
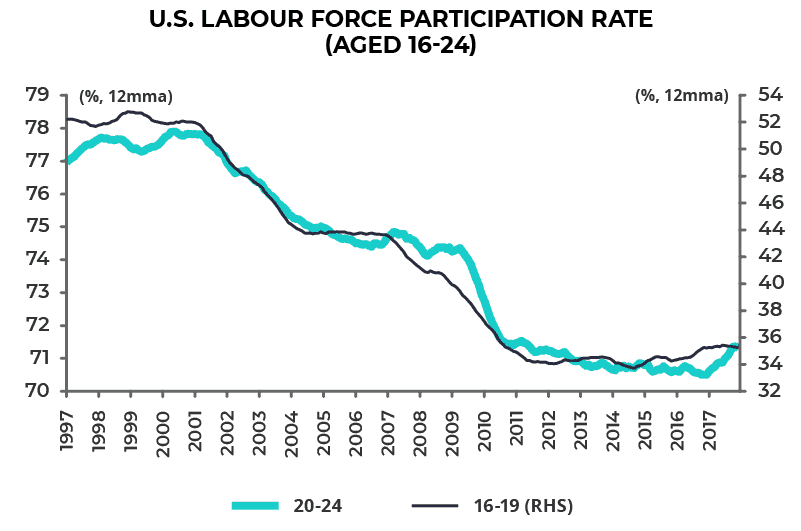
Source: CLSA, U.S. Bureau of Labour Statistics
Millennial Consumption: Incomes Rising & Debt Load not Disastrous
All of the above is of interest since it raises the potential for an inflection point in the relatively weak consumption trend, which has been a feature of the American economy since the 2008 financial crisis as savings rates have risen. For evidence of this, two data points are worth highlighting.
Real Income Now on the Rise
The first is that the real median household income for older millennials defined as aged 25 to 34 has turned higher. Real median household income for householders aged 25-34 has risen by 13.4% from a low of US$53,712 in 2012 to a 15-year high of US$60,932 in 2016 (see following chart).
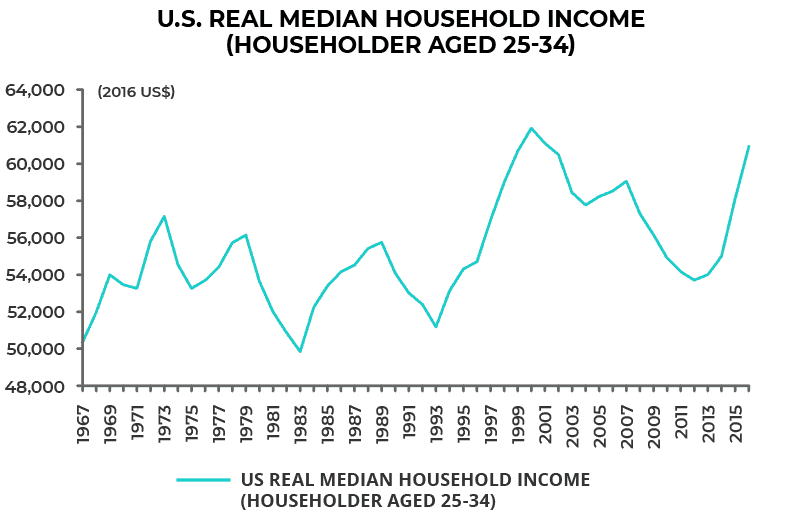
Source: CLSA, U.S. Census Bureau
Leverage Limited to Student Debt
Second, the student debt trend is not quite as disastrous as the gross number would suggest, namely US$1.36 trillion with a formal delinquency rate of 11.2%. The overall situation is not so grim because millennials otherwise do not carry much debt, if any, because no one would lend to them after the global financial crisis.
This is the consequence primarily of the over-the-top regulation of mortgage lending following the 2007 triggered U.S. housing crisis. But these regulatory standards have now been relaxed in the U.S., most particularly since Donald Trump became president. This can be seen in the previously discussed renewed rise in the homeownership rate. It can also be seen in the new mortgage lending applications index. The U.S. new purchase mortgage applications index has risen by 68% from a low of 152.4 at the end of 2014 to 255.5 last week.
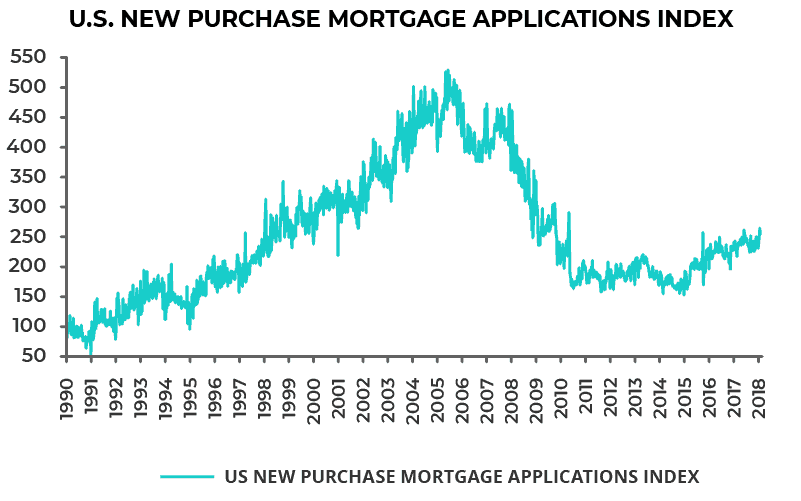
Source: Mortgage Bankers Association of America, Bloomberg
Good News for the Millennial Cohort (Consumption Stoking Inflation) Will be Negative for the Market (Monetary Tightening)
Clearly demographics drive long-term trends. So these are potentially huge developments in what is for now still the world’s largest economy.
If U.S. growth really does recover in the manner the cyclical optimists are now expecting, by which is meant 3-4% growth compared with the average annualized U.S. real GDP growth of 2.2% since mid-2009, it will not be positive for financial assets because there will be a massive monetary tightening scare triggered by increased inflation concerns.
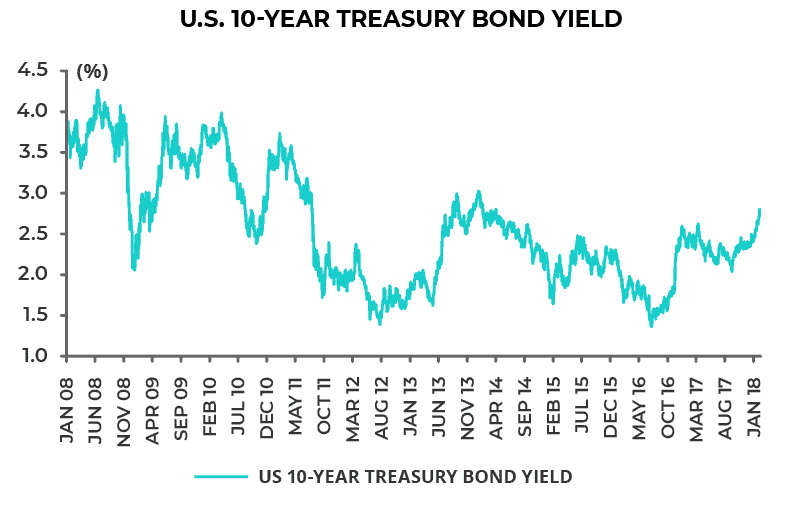
That is for now still more a hypothetical projection than a looming reality. U.S. real GDP was 2.5% YoY in 4Q17, based on the latest data, while the ten-year Treasury bond still yields only 2.8%, though that is up 44bp from the level prevailing before the U.S. Congress passed tax reform on December 20, thereby increasing cyclical acceleration hopes for the American economy (see following chart).
Source: Mortgage Bankers Association of America, Bloomberg
About Author
The views expressed in Chris Wood’s column on Grizzle reflect Chris Wood’s personal opinion only, and they have not been reviewed or endorsed by Jefferies. The information in the column has not been reviewed or verified by Jefferies. None of Jefferies, its affiliates or employees, directors or officers shall have any liability whatsoever in connection with the content published on this website.
The opinions provided in this article are those of the author and do not constitute investment advice. Readers should assume that the author and/or employees of Grizzle hold positions in the company or companies mentioned in the article. For more information, please see our Content Disclaimer.

