

If the American president is annoying people ‘overseas’ with tariff increases and the like, at home the story is a little different. If the chart below was of a stock this writer would buy it (see following chart).
President Donald Trump’s average job approval rating

The chart is, obviously, the approval rating of Donald Trump. This is why the base case should be that the Republicans maintain control of Congress in November. This is primarily because Trump’s approval rating is on a rising trend and the American economy is also seemingly improving.
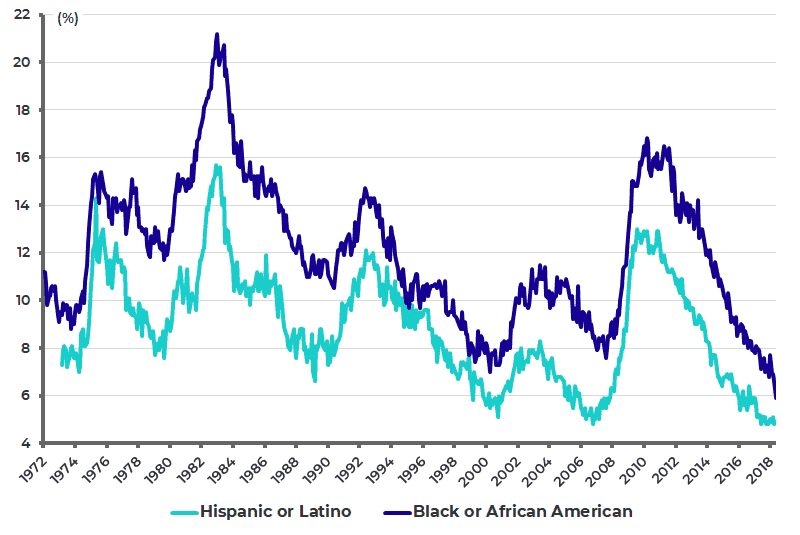
Trump and the Republican candidates will cite, among other positives, record employment among minorities (see following chart) and also a record low unemployment rate in 14 states (see following table).
US Unemployment Rates for Minorities
US States With Record Low Unemployment Rate in the Past Year
| State | Apr-18 | Historical High | Historical Low | ||
| rate(%) | Month | Rate (%) | Month | Rate (%) | |
| California | 4.2 | Nov-10 | 12.3 | Apr-18 | 4.2 |
| Hawaii | 2.0 | Mar-76 | 10.2 | Apr-18 | 2.0 |
| Idaho | 2.9 | Dec-82 | 10.2 | Apr-18 | 2.9 |
| Kentucky | 4.0 | Mar-83 | 12.0 | Apr-18 | 4.0 |
| Maine | 2.7 | Jan-77 | 9.0 | Apr-18 | 2.7 |
| Oregon | 4.1 | May-09 | 11.9 | Apr-18 | 4.1 |
| Wisconsin | 2.8 | Jan-83 | 11.9 | Apr-18 | 2.8 |
| Mississippi | 4.6 | Apr-83 | 12.8 | Mar-18 | 4.5 |
| Alabama | 3.8 | Dec-82 | 15.5 | Feb-18 | 3.7 |
| Tennessee | 3.4 | Jan-83 | 12.9 | Jan-18 | 3.3 |
| Texas | 4.1 | Nov-86 | 9.2 | Nov-17 | 3.9 |
| North Dakota | 2.6 | Feb-83 | 6.2 | Jul-17 | 2.5 |
| Arkansas | 3.8 | Feb-83 | 10.3 | May-17 | 3.6 |
| Colorado | 2.9 | Dec-10 | 8.9 | May-17 | 2.6 |
Note: Seasonally adjusted data since January 1976. Source: US Bureau of Labour Statistics
Democrats Remain Fixated on Russian Interference and ‘Stormy’
The other point is that the Democrat message remains primarily negative. This can be seen in the continuing obsessive media focus on alleged Trumpian wrongdoings, be it alleged involvement with Russian interference in the presidential election campaign or the so-called ‘Stormy’ Daniels case.
It is hard not to form the impression that Trump’s political opponents still find it hard to deal with the reality that he is president. As for Donald Trump, it cannot be denied that he is shaking things up. This writer has the impression that this is refreshing to many of the electorate after the platitudinous politically correct cacophony that has characterized so much political rhetoric in recent years.
Safe Spaces be Damned – Millennials take a Liking to the Donald
Meanwhile, an interesting poll was published last month reporting the results of a Reuters/Ipsos poll of 16,000 millennials (see Investor’s Business Daily article “Why Are Millennials Turning Against Democrats?”).
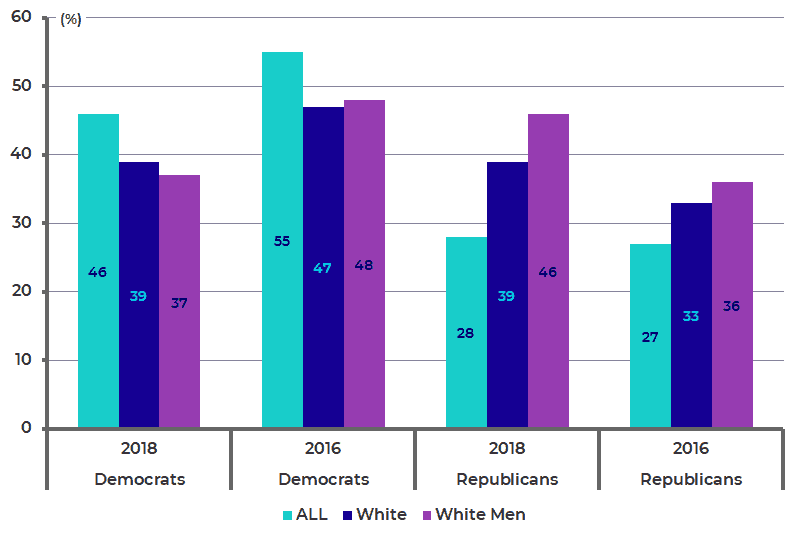
This poll found that support for the Democrats among this generation declined by 9 percentage points to 46%, down from 55% two years ago. Also only 39% of millennial white Americans now say they favour the Democrats, down from 47% in 2016 (see following chart).
Reuters/Ipsos Poll of Millennials in the US: Support for Democrats or Republicans
This is interesting given that the millennial generation, numbering 85 million, is now the largest cohort in the American economy. The article attributes the change in polling to the millennials, comprising the age group 18 to 36, becoming more financially conservative as they start to get married and have children and even buy houses.
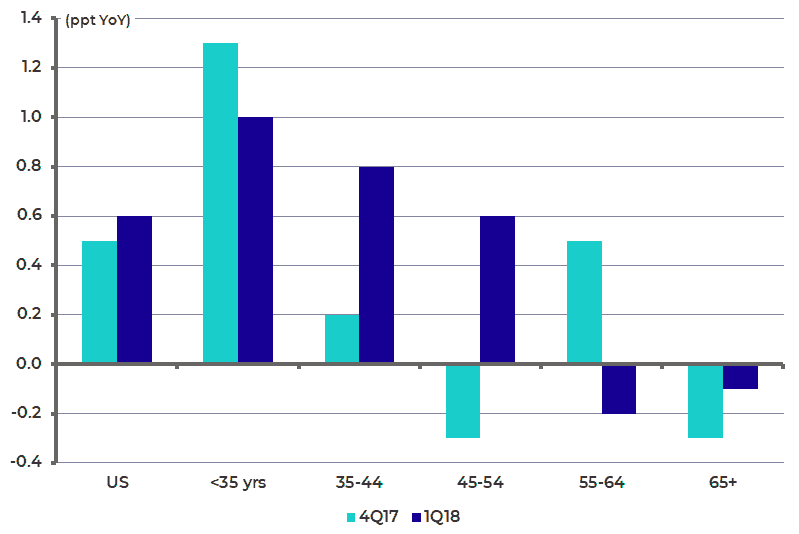
The National Association of Homebuilders reported in early April that the homeownership rate of millennials registered the largest gains among all age groups in 2017, based on Census Bureau data. More precisely, the Census Bureau data shows that the non-seasonally adjusted homeownership rate for householders aged under 35 years old rose by 1.3ppt YoY to 36% in 4Q17 and was up 1.0ppt YoY to 35.3% in 1Q18, the biggest annual increase among all age groups (see following chart).
YoY Change in US Homeownership Rates by Age of Householder
It is also the case that the employment-to-population ratio among 25 to 34 year olds is finally back to the pre-financial crisis level of 79% after remaining in the low- to mid-70% range from 2009 to 2015 which coincides with the tenure of the Obama administration (see following chart). Meanwhile the median age for a first marriage in the US is now 27.4 for women and 29.5 for men.
US Employment to Population Ratio (25-34 years old)

Employment Data a Tailwind for the White House
If the above polling data is more encouraging for the Republicans than worrying for the Democrats, it is also the case that the latest employment data will have been welcomed by the White House. Nonfarm payrolls increased by 223,000 jobs in May, up from 159,000 in April. This compares with an average monthly increase of 191,000 over the previous 12 months.
As for the wage data, it remains in the Goldilocks range for the Federal Reserve (i.e. neither too hot nor too cold), allowing Fed Chairman Jerome Powell to keep on track with his policy of gradual tightening.
US Increase in Nonfarm Payrolls and Average Hourly Earnings Growth

US Employment Cost Index
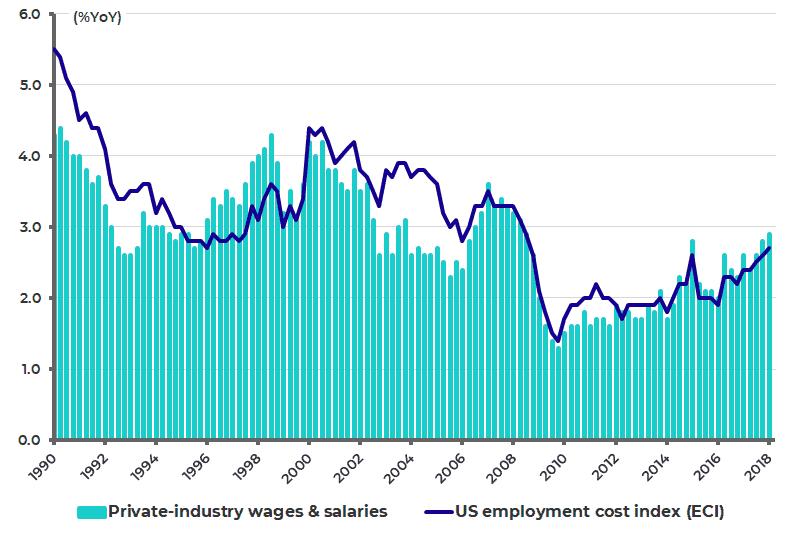
If the continuing comparative weakness of wage growth continues to surprise economists, it reflects the reality that it will take time for American labour to become assertive. A part-time worker who has just been made permanent will, in the first instance, just be happy to have the job security.
It is also worth noting that the decline in the unemployment rate, from 3.9% in April to 3.8% in May, is again primarily due to another drop in the participation rate. The labour force participation rate declined from 62.8% in April to 62.7% in May, while the number of Americans not in the labour force increased by 170,000 to a new record 95.9 million (see following chart). This means the US is not at full employment despite all the commentary to the contrary.
US Labour Force Participation Rate and Americans not in the Labour Force

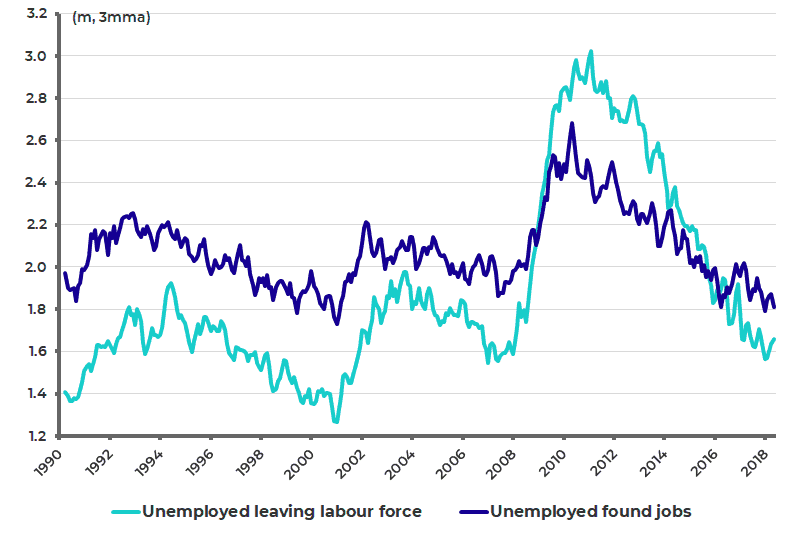
It is also worth recording that the participation ratio remains above the 40-year low of 62.3% reached in September 2015, as the number of unemployed Americans who have found a job continues to exceed those leaving the labour force (see following chart). This suggests that not all of those Americans who have been out of the workforce are permanently unemployable.
US Labour Force Status Flows: Unemployed Americans who found a job or Leaving the Labour Force
If the base case is that the employment and wage trends continue to show gradual improvement through to the November election, then the Republicans should win.
The views expressed in Chris Wood’s column on Grizzle reflect Chris Wood’s personal opinion only, and they have not been reviewed or endorsed by Jefferies. The information in the column has not been reviewed or verified by Jefferies. None of Jefferies, its affiliates or employees, directors or officers shall have any liability whatsoever in connection with the content published on this website.
The opinions provided in this article are those of the author and do not constitute investment advice. Readers should assume that the author and/or employees of Grizzle hold positions in the company or companies mentioned in the article. For more information, please see our Content Disclaimer.