

If you took a look at Japan’s extreme monetary policy, it would be easy to think the country was stuck in dreadful deflation. The reality is nothing so bad. While there is every risk that a weakening external environment feeds through into domestic weakness in coming quarters, it is also the case that Japan remains at full employment.
Full Employment More Important Than Inflation
The gap between inflation in Japan and other countries has also been narrowing in recent years as Japan’s long-existing deflationary conditions have spread to other areas of the G7 world. In this sense, while Japan has been a lead indicator of the now widely recognized deflationary trend in the world economy, it is no longer unique.
Meanwhile, Japanese Prime Minister Shinzo Abe’s government now understands that the Bank of Japan’s 2% inflation target is no longer the holy grail of policy, as it was at the launch of so-called Abenomics in 2013. Rather the main goal of policy is full employment and this has been more than achieved as reflected in the continuing rise in aggregate compensation paid in the Japanese economy.
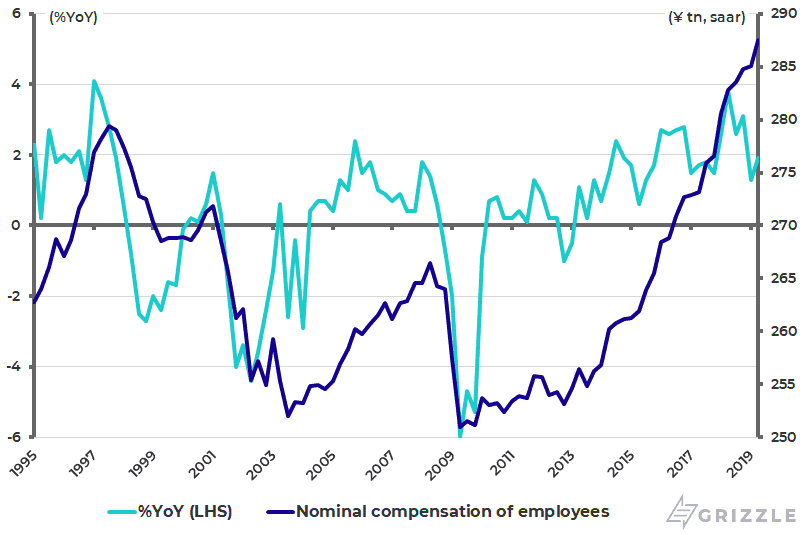
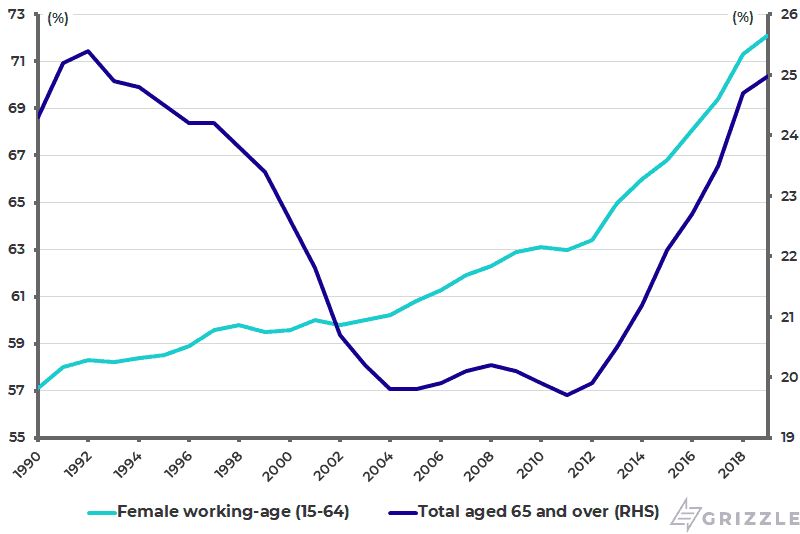
Given the aging demographics, this is a result of both a rising female participation rate and elderly workers remaining in the workforce for longer. Total compensation of employees rose by 1.9% YoY in 2Q19 and is up 14.6% since bottoming in 2Q09 to a record annualized ¥288 trillion in 2Q19 (see following chart). Meanwhile, the female working-age labour participation rate has risen from 63% in 2011 to an annualized 72.1% in July 2019, with the participation rate for those aged 65 or above rising from 19.7% to 25% over the same period (see following chart).
Japan Nominal Compensation of Employees
Japan Female Working-age and Elderly Labour Participation Rate
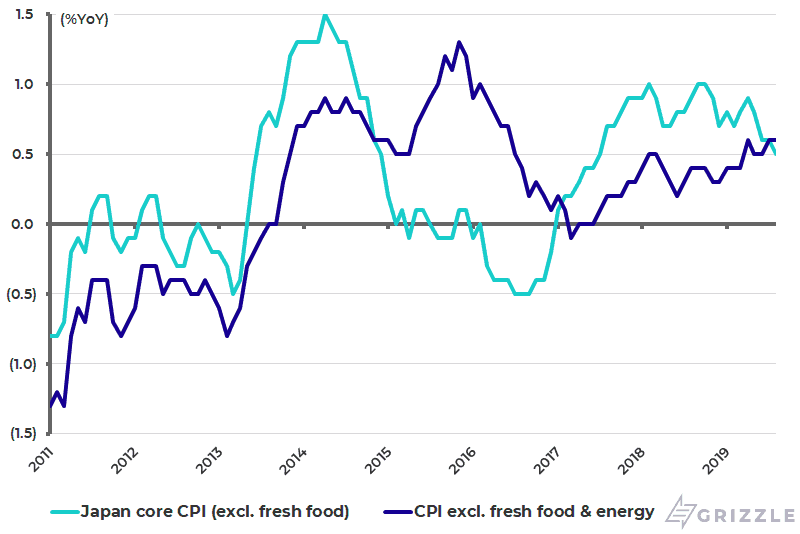
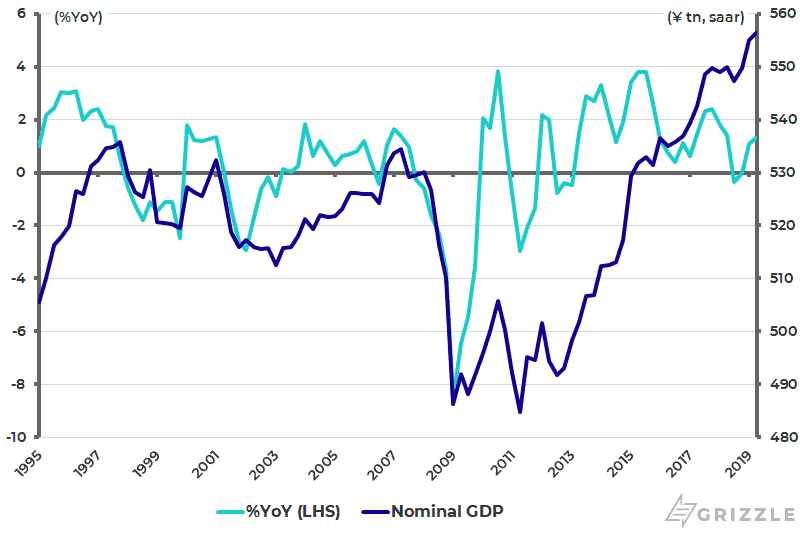
This is a positive since the view I have always had that the 2% inflation target of BoJ Governor Haruhiko Kuroda, set back in 2013 when he first took office, was unrealistic given Japan’s trend growth rate of about 1%. In this respect, the positive point is that core CPI remains in positive territory while, importantly, nominal GDP growth has been positive for 23 of the past 25 quarters. Japan’s core-core CPI, which excludes fresh food and energy, rose from 0.5% YoY in June to 0.6% YoY in July and August (see following chart). Meanwhile, nominal GDP rose by 1.3% YoY in 2Q19 and is up an annualized 1.7% over the past six years (see following chart).
Japan Core CPI Inflation
Japan Nominal GDP Trend
Will There Be More Monetary Easing?
If the political pressure on the BoJ to ease policy more has reduced, if not ended, Kuroda is still formally at least committed to the 2% target. That, and the expectations of more easing to come by both the Federal Reserve and the ECB, creates a certain pressure on the Japanese central bank to be seen to be doing something.
Still, the Japanese central bank remains reluctant to cut short-term rates from the current level of minus 0.1% because of the huge criticism Kuroda encountered, both from the banking sector and ordinary savers, when he first moved to negative rates in February 2016. In this respect, the blowback against negative rates has been much greater in Japan than the Eurozone to the Japanese people’s credit. For this reason there was no rate cut at the BoJ meeting on Sept. 19 while the ECB cut rates by a further 10bp to minus 0.5% on Sept. 12. This means short-term rates are already 40bp more negative in the Eurozone than in Japan.
Still, that does not mean that more monetary easing is off the agenda altogether in Japan. Both fiscal and monetary policy will likely be on “wait and see” mode as the authorities wait to see the impact of the sales tax increase from 8% to 10% due to be implemented on Oct. 1.
Incentivizing Consumption
The major difference this year from the last sales tax increase in 2014, after which the Japanese economy collapsed, is that the government has come up with a number of policies to try and incentivize consumption after October in order to mitigate the impact. Examples are an increased tax break for purchases of houses and a reduction in car taxes. It is also worth noting, given the demographics, that nursery education for three to five-year-old children will be free from October for all families. While this and other policies designed to encourage procreation make obvious sense in Japan, the best approach would be to increase the cash incentive materially for child-raising, for example, an eye-catching cash subsidy of at least ¥10m (US$93,000) per child!
But returning to the sales tax issue, the base case here remains that the fallout will be much less than last time. There has not been the same aggressive buying of housing and cars ahead of the pending sales tax increase. It is also the case that the scale of the sales tax increase is less than in 2014, when it was increased by 3ppts from 5% to 8% in April 2014.
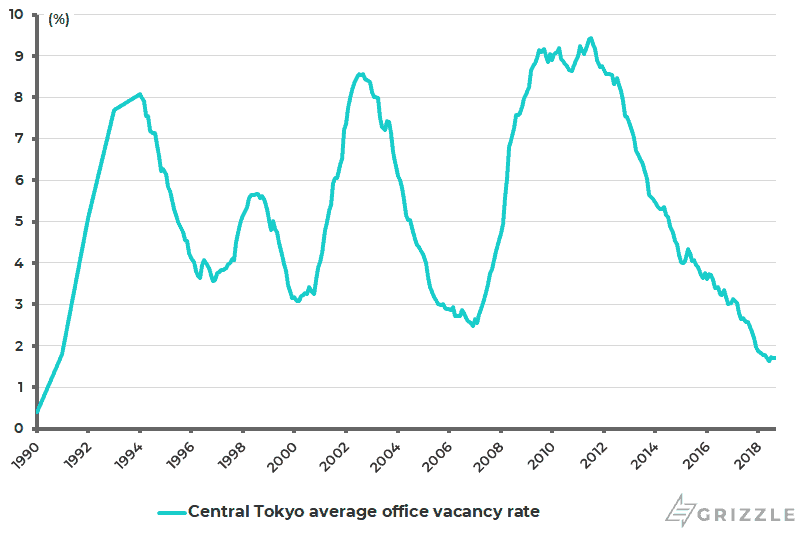
Meanwhile, returning again to the theme of the resilience of domestic demand, the central office vacancy rate in Tokyo fell to 1.64% in May, the lowest level since 1990 at the peak of the Japanese “Bubble Economy”, and was 1.71% in August (see following chart).
Central Tokyo Average Office Vacancy Rate
Land prices have also finally started rising outside the three major metropolitan areas of Tokyo, Osaka, and Nagoya for the first time since 1992. The official published land prices for the three metro areas rose by an average 2% this year, the sixth consecutive year of increase since 2014, while land prices in regional areas outside these three metro areas rose by 0.4% in 2019 (see following chart).
Japan Published Land Price Changes

The views expressed in Chris Wood’s column on Grizzle reflect Chris Wood’s personal opinion only, and they have not been reviewed or endorsed by Jefferies. The information in the column has not been reviewed or verified by Jefferies. None of Jefferies, its affiliates or employees, directors or officers shall have any liability whatsoever in connection with the content published on this website.
The opinions provided in this article are those of the author and do not constitute investment advice. Readers should assume that the author and/or employees of Grizzle hold positions in the company or companies mentioned in the article. For more information, please see our Content Disclaimer.