This writer focused last week on the fact that the liquidity contraction is only now really beginning to bite based on an analysis of the trend in the M2 to nominal GDP ratio (see The US Economy Is Strong … But For How Much Longer?, 21 February 2024).
Still to focus on M2 is to imply that broad money or M2 is important.
In this writer’s view the importance of M2 as a lead indicator of inflation was proven again with the surge in inflation in America which followed the huge monetary expansion by the Fed in reaction to the pandemic in 2020.
US M2 growth exploded from 6.8% YoY in February 2020 to 26.9% YoY in February 2021, while US CPI inflation rose from 1.4% YoY in January 2021 to 9.1% YoY in June 2022.
Still it should be noted again that the Fed has never admitted to this connection and has chosen to emphasise supply chain bottlenecks triggered by Covid-triggered lockdowns and the like as the cause of the inflation.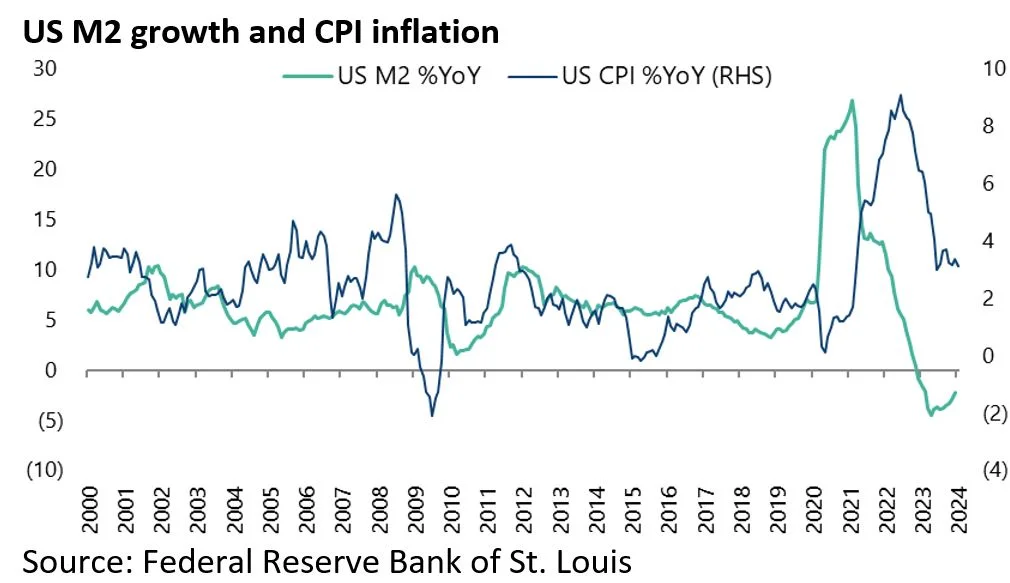
While such Covid-specific factors undoubtedly aggravated the inflationary pressures, they were not the prime driver.
In this respect, Asia and other developing countries remain the proof that G7 central bank financing of transfer payments was the prime driver of the inflation.
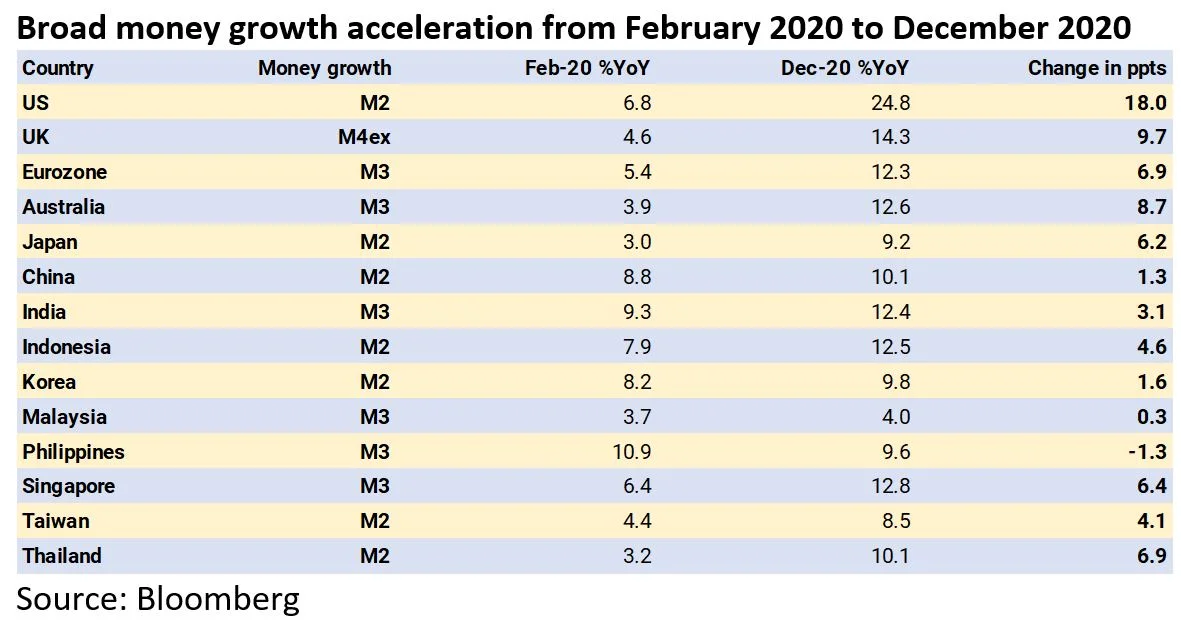
This is because Asia did not experience anything like the same level of broad monetary expansion during the pandemic and, as a result, the increase in inflation was much more modest, as shown in the table below.
Thus, US M2 growth increased by 18 percentage points from 6.8% YoY in February 2020 to 24.8% YoY at the end of 2020, while broad money growth in China, India, and Indonesia increased by only 1.3ppt, 3.1ppts, and 4.6ppts, respectively, over the same period.
US Money Printing Drove Emerging Market Bond Outperformance
This is also why emerging market bonds have so dramatically outperformed G7 bonds in US dollar terms since the pandemic.
The Bloomberg Emerging Markets Local Currency Government Bonds Index has outperformed the Bloomberg G7 Government Bond Index by 37% in US dollar terms since 23 March 2020.
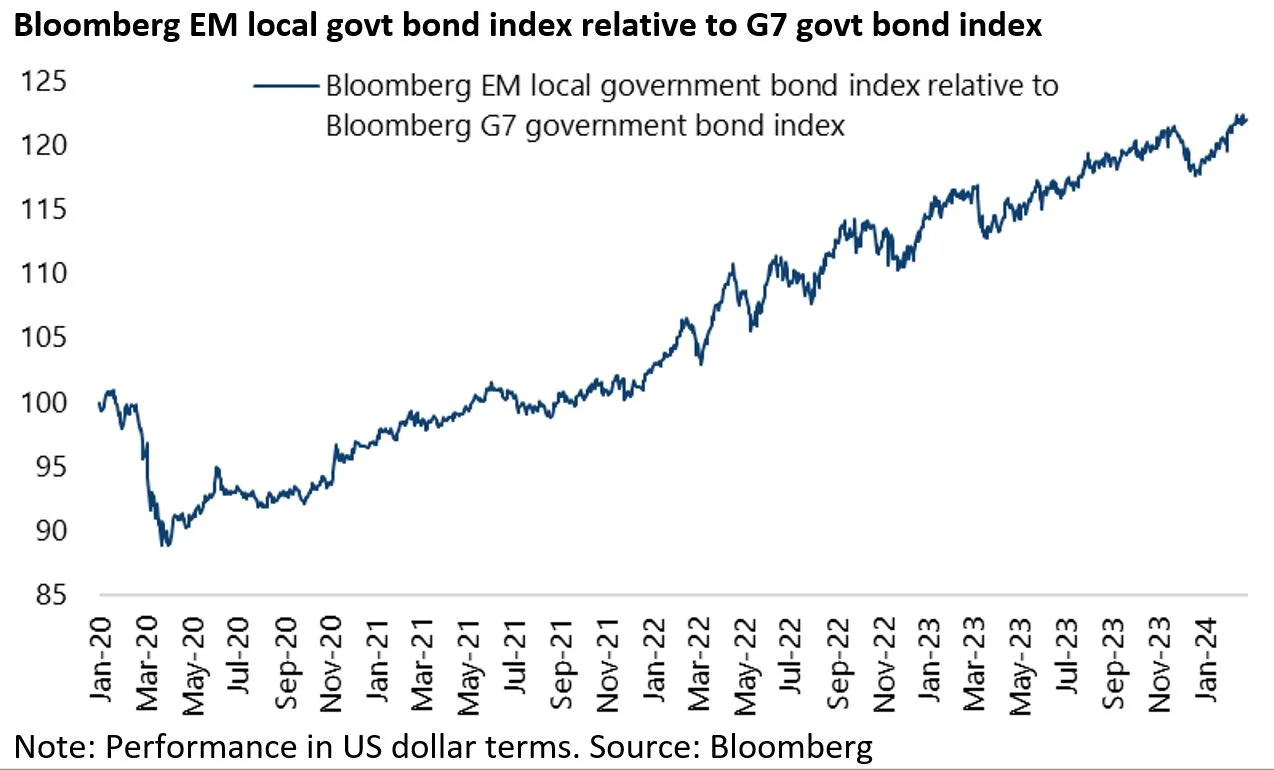
It is also why, importantly, emerging market central banks will have a lot of room to ease monetary policy in a world where the Fed is easing and the US dollar is weakening.
Money Supply as a Recession Indicator Will be Tested This Year
Still if this is the view, it is only fair to acknowledge that there is an alternative narrative.
This was articulated by Bill Dudley, the former president of the Federal Reserve Bank of New York, in an interview with the Financial Times last quarter.
While not denying the surge in M2 growth prompted by the pandemic, Dudley argued that that would be a more “compelling” explanation if inflation had picked up after the global financial crisis in 2008 when there was also “rapid growth of M2” (see Financial Times article: “Bill Dudley: Inflation wasn’t caused by too much money”, 10 November 2023).
There are two responses to this.
- First, the growth in M2 in 2008 was nothing like what occurred in 2020. US M2 growth only rose from 5.5% YoY in August 2008 to a then peak of 10.2% YoY in January 2009.
- Second, the key difference between 2008 and 2020 was that in 2020 the Fed indirectly financed fiscal transfer payments which meant that money was put directly into people’s pockets or, to put it crudely, people were paid to do nothing. This did not happen in 2008. Rather the impact of the introduction of quantitative easing in 2008 was primarily via asset price inflation, which was the prime driver in the resulting surge in wealth inequality.
Still whatever the arguments, it is clear that 2024 will be another stress test of whether the money supply, as an indicator, is important or whether it has lost all relevance in a world where central bank balance sheets remain, despite quantitative tightening, extremely bloated.
The Fed balance sheet ended last week at US$7.58tn, down only by US$1.38tn or 15% from the peak reached in April 2022.
It is also the case that Fed balance sheet expansion is likely to resume the moment the US central bank becomes really concerned about an economic downturn.
Such an expansion is also likely to take the form of renewed Fed purchases of Treasury bonds.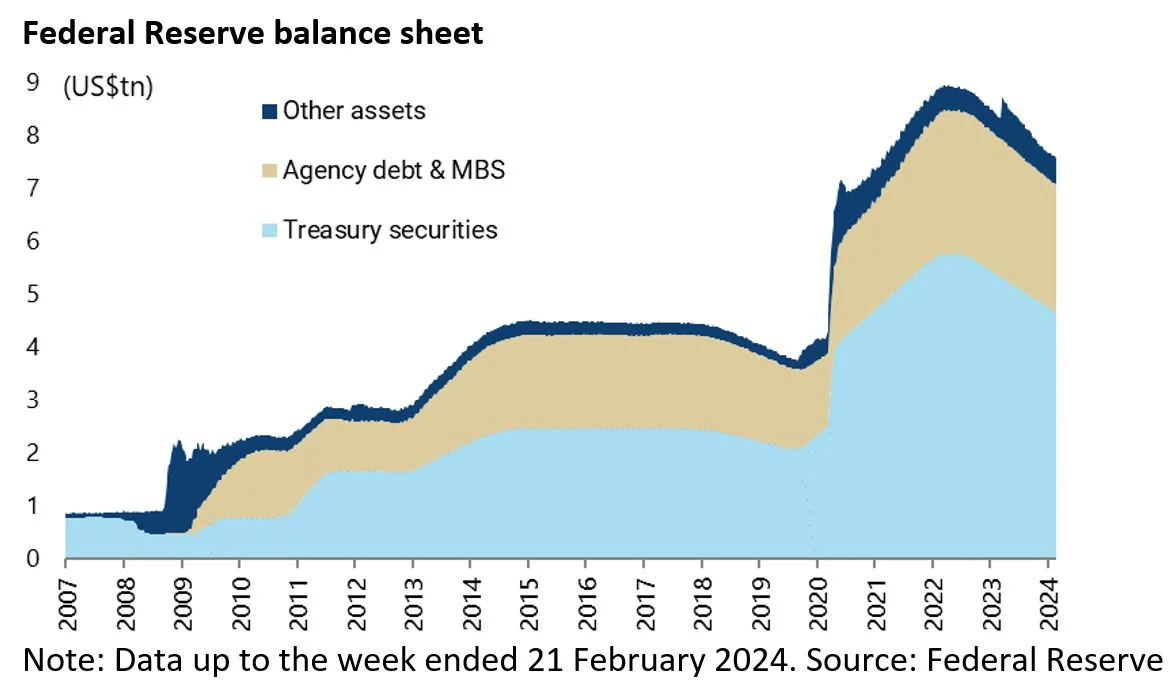
Breaking Down the Recent Treasury Bond Rally
Meanwhile the past quarter saw a spectacular rally in Treasury bonds following an equally spectacular selloff in the previous quarter.
The Bloomberg US Long (10Y+) Treasury Index rose by 21% on a total-return basis since bottoming on 19 October before peaking on 27 December.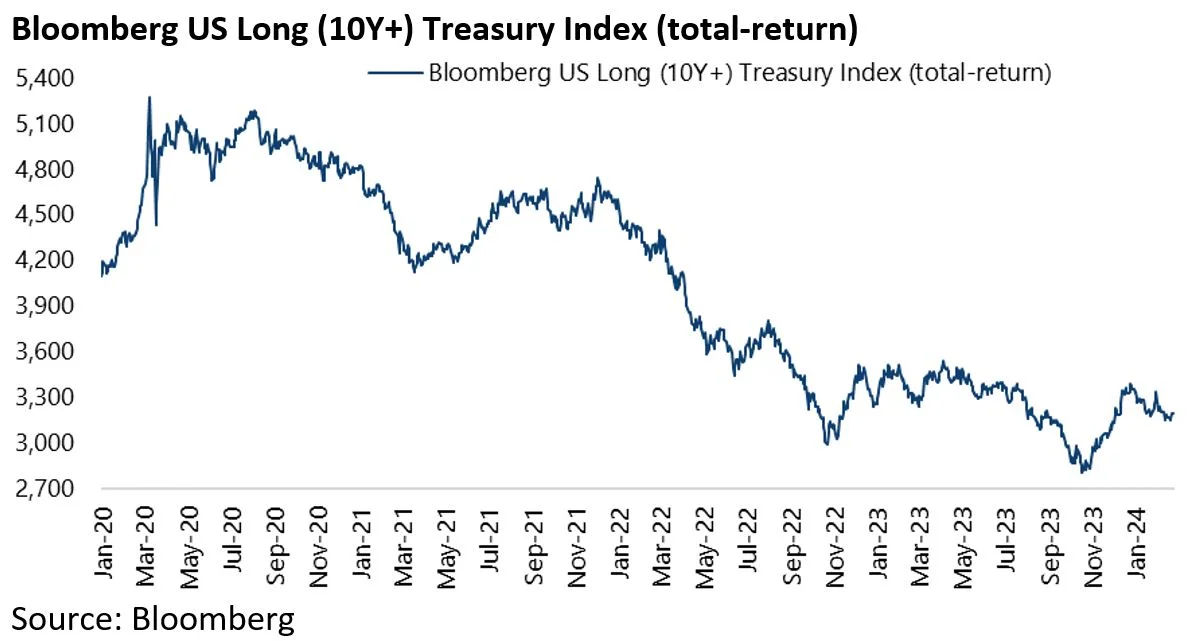
The trigger for the rally was the announcement on 1 November of the details of the next quarterly Treasury refunding, which showed less longer-dated paper to be sold than previously expected.
The details are worth spelling out again.
For the November-January quarter, the 2-year and 5-year auction sizes were set to increase by US$3bn per month and the 3-year by US$2bn per month.
By contrast, auction sizes of the 10-year and 30-year bonds would be increased by only US$2bn and US$1bn, respectively, compared with the corresponding month in the previous quarter (August-October), while the auction size of the 20-year paper would remain unchanged.
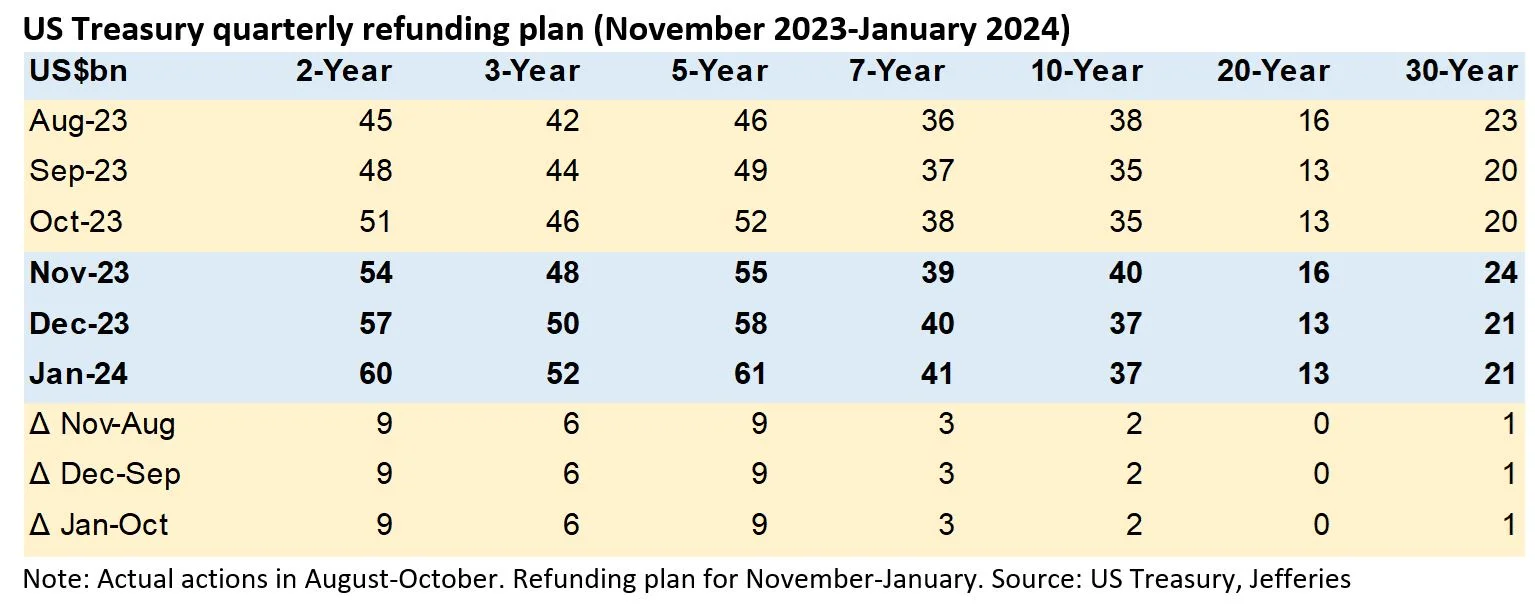
The market’s sensitivity to the details of the funding suggests supply concerns have entered the Treasury bond market.
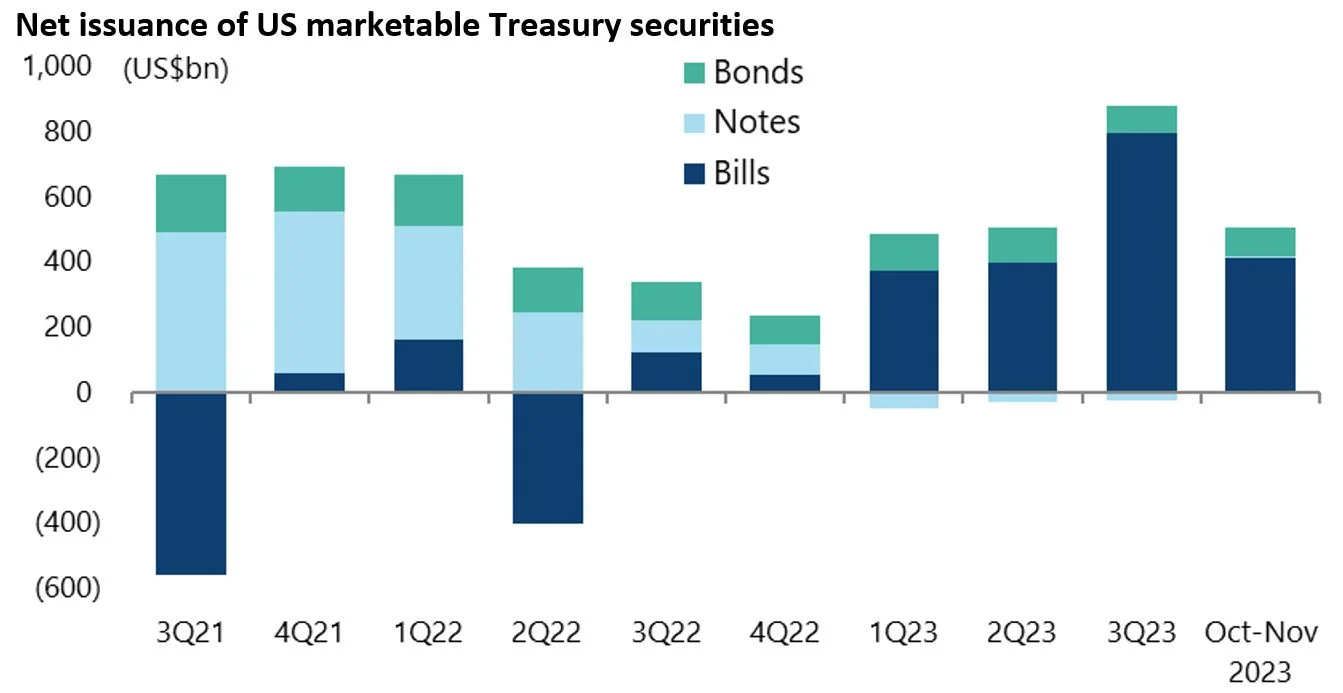
It is also the case that historical data shows that net issuance of Treasury bills (i.e. maturities of less than one year) accounted for a huge 81% of the total net issuance of Treasury securities in October-November and 87% in the first 11 months of 2023.
By contrast, Treasury bills accounted for only 30% of net issuance of Treasury securities in 2H22.
US Debt Servicing Costs are No Joke
Meanwhile, the latest data has again reconfirmed the rising cost of debt servicing.
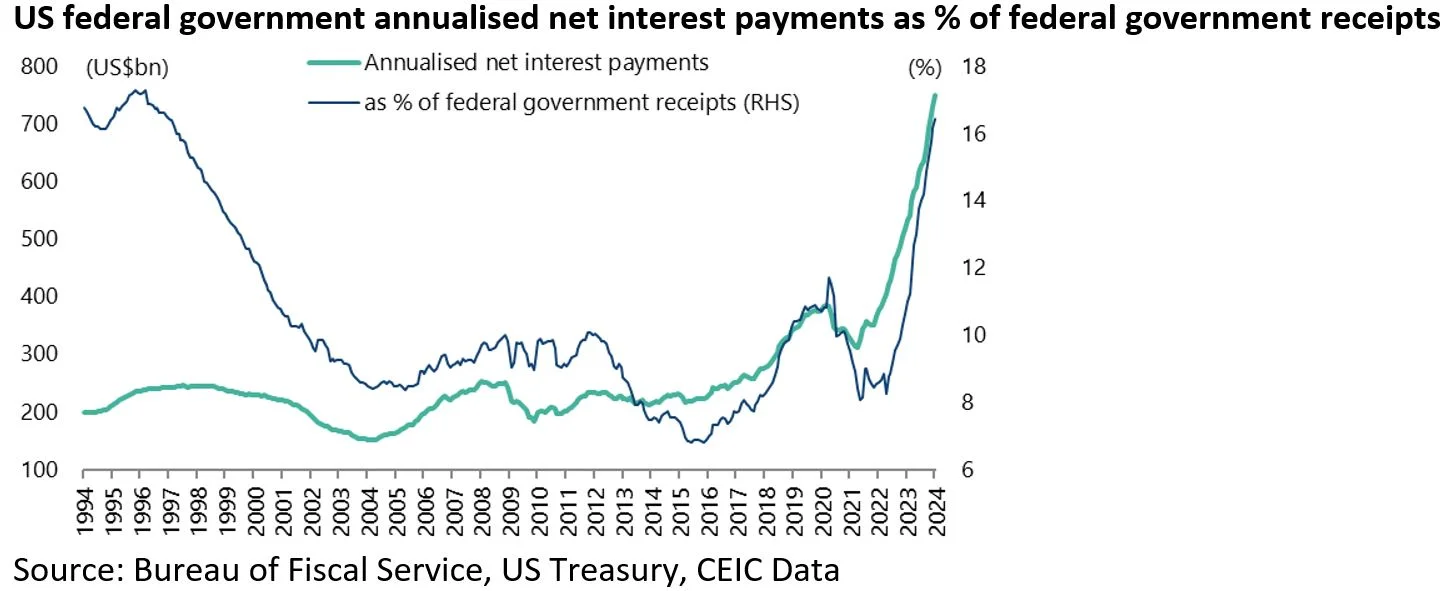
US annualised net interest payments as a percentage of federal government revenues have risen from 8.3% in April 2022 to 16.4% in January 2024, the highest level since December 1996.
While in US dollar terms federal government’s net interest payments have almost doubled from US$345bn in FY20 ended 30 September 2020 to a record US$659bn in FY23 ended 30 September 2023 and an annualized US$748bn in the 12 months to January.
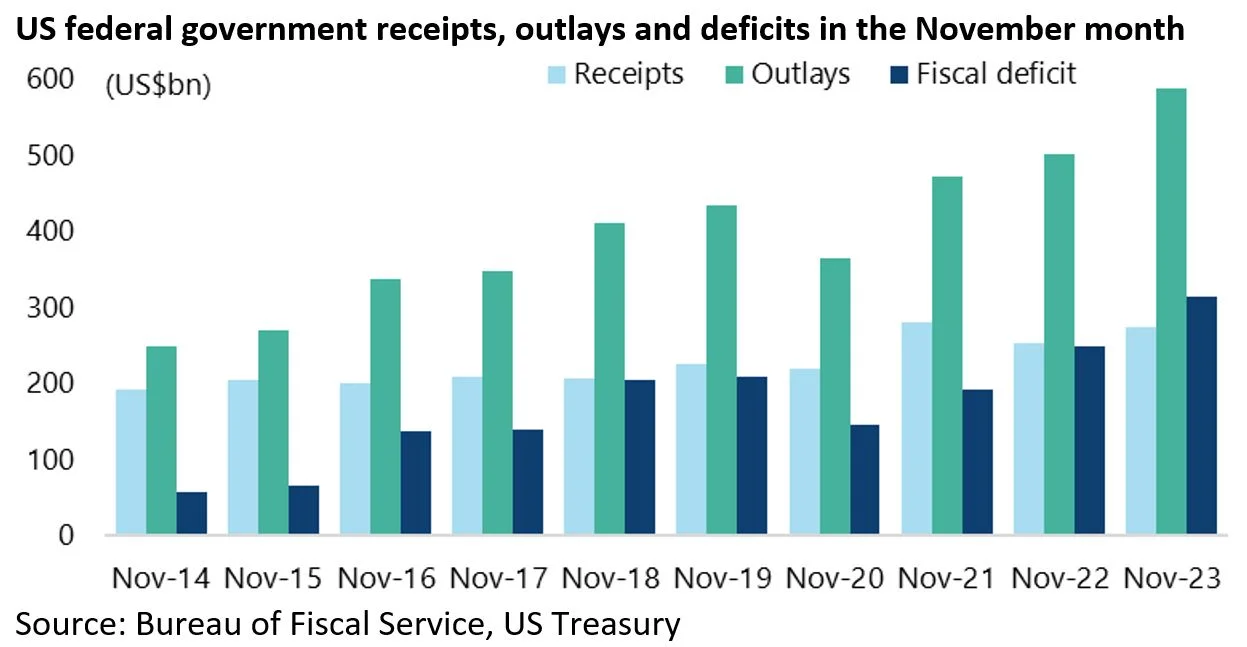
The November fiscal data is worth highlighting in detail to highlight the alarming deterioration.
The federal deficit was a record high (for November) of US$314bn, up 26% YoY or US$65bn from US$248bn in November 2022 (see following chart).
This was because government outlays rose by 18% YoY or by US$88bn to US$589bn while revenues rose by US$23bn or 9% YoY to US$275bn.
In terms of the actual spending items the big outlays are non-discretionary in the sense that they are mandated entitlements.
Thus, US$116bn was spent on social security in November and US$79bn and US$50bn on Medicare and Medicaid, respectively.
While US$80bn went on interest expense.
Meanwhile, on a rolling three-month basis, the US fiscal deficit was up 25% YoY to US$465bn in the three months to January.
On that point, the Committee for a Responsible Federal Budget has projected that net interest payments will surpass US$800bn this fiscal year beginning 1 October.
The Real Reason for any Future Interest Rate Cuts?
This is a context where it is also possible to argue that another motive for the perceived Powell pivot in the December FOMC meeting was to reduce the federal government’s debt servicing bill which has been rising because of monetary tightening.
Still the ever-growing reliance on short-term paper poses refinancing risks, most particularly if the bond market becomes alarmed again about supply concerns and so-called “fiscal sustainability”.
On this point, it is worth highlighting again that 53% of US marketable Treasury securities outstanding as at the end of January will mature before the end of 2026.
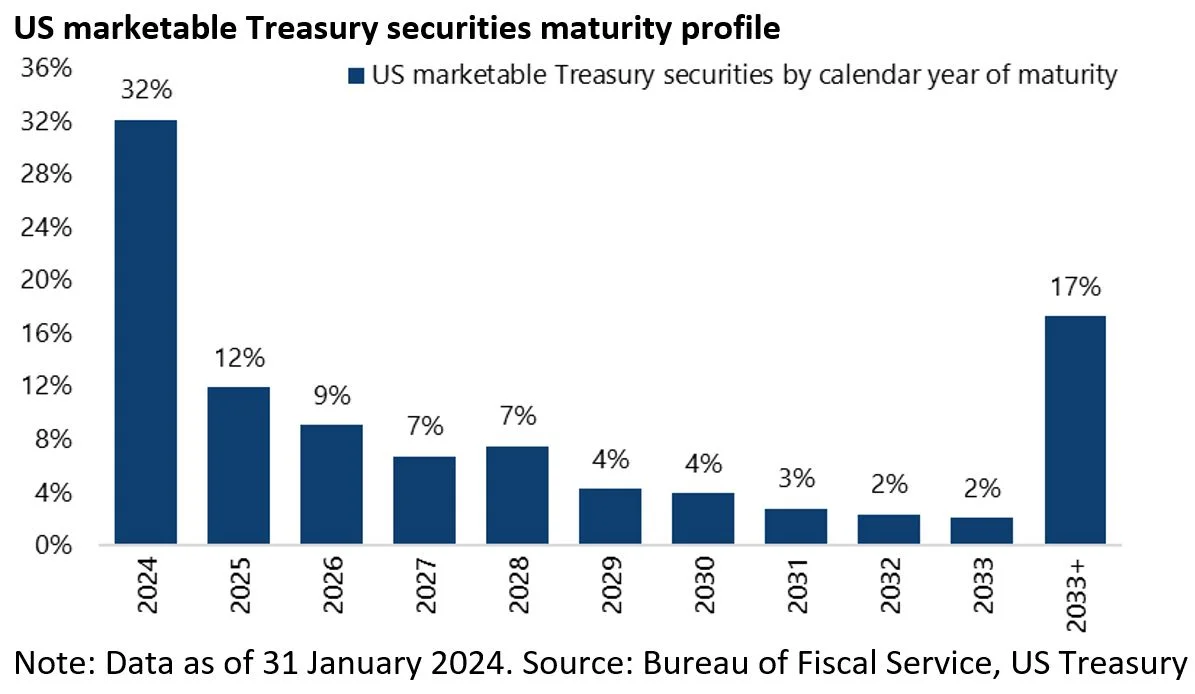
The bottom line is that the potential for dramatic fiscal deterioration in a real economic downturn, given how high the deficit has been in an economic upturn, is obvious.
And this is in a context where neither major political party in America seems remotely ready, as yet, to embrace fiscal austerity whatever the outcome of the presidential election in November.
About Author
The views expressed in Chris Wood’s column on Grizzle reflect Chris Wood’s personal opinion only, and they have not been reviewed or endorsed by Jefferies. The information in the column has not been reviewed or verified by Jefferies. None of Jefferies, its affiliates or employees, directors or officers shall have any liability whatsoever in connection with the content published on this website.
The opinions provided in this article are those of the author and do not constitute investment advice. Readers should assume that the author and/or employees of Grizzle hold positions in the company or companies mentioned in the article. For more information, please see our Content Disclaimer.
