The base effect worked for investors with last week’s October US CPI data.
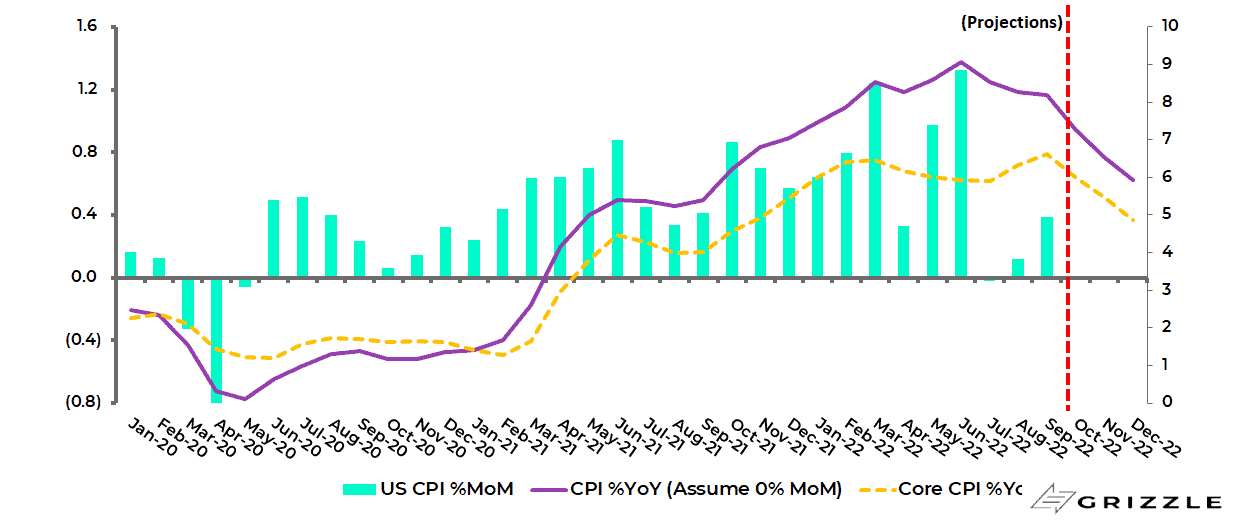
Remember, the CPI month-on-month change slowed from 0.9% in June 2021 to 0.3% in August 2021 and 0.4% in September 2021 before rising to 0.9% in October 2021.
This suggested the best hope for a fall in CPI inflation would come in the October data point. This is what has now happened.
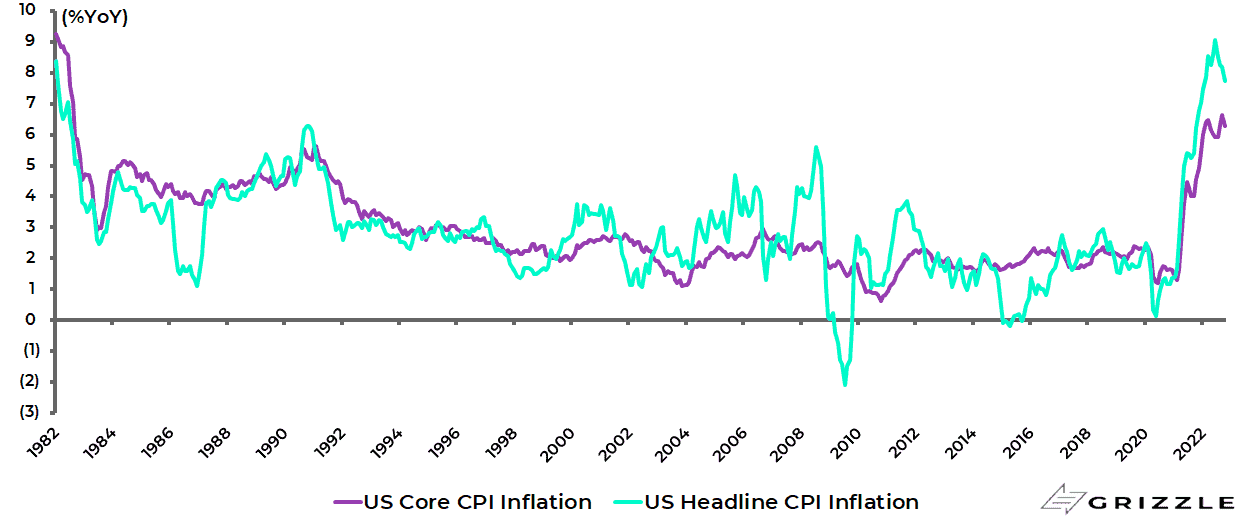
US headline CPI rose by 0.4% MoM and 7.7% YoY in October, compared with consensus estimates of 0.6% MoM and 7.9% YoY, down from 8.2% YoY in September.
Core CPI inflation also slowed from 0.6% MoM and 6.6% YoY in September to 0.3% MoM and 6.3% YoY in October, compared with consensus estimates of 0.5% MoM and 6.5% YoY.
US CPI inflation
Source: Bureau of Labor Statistics
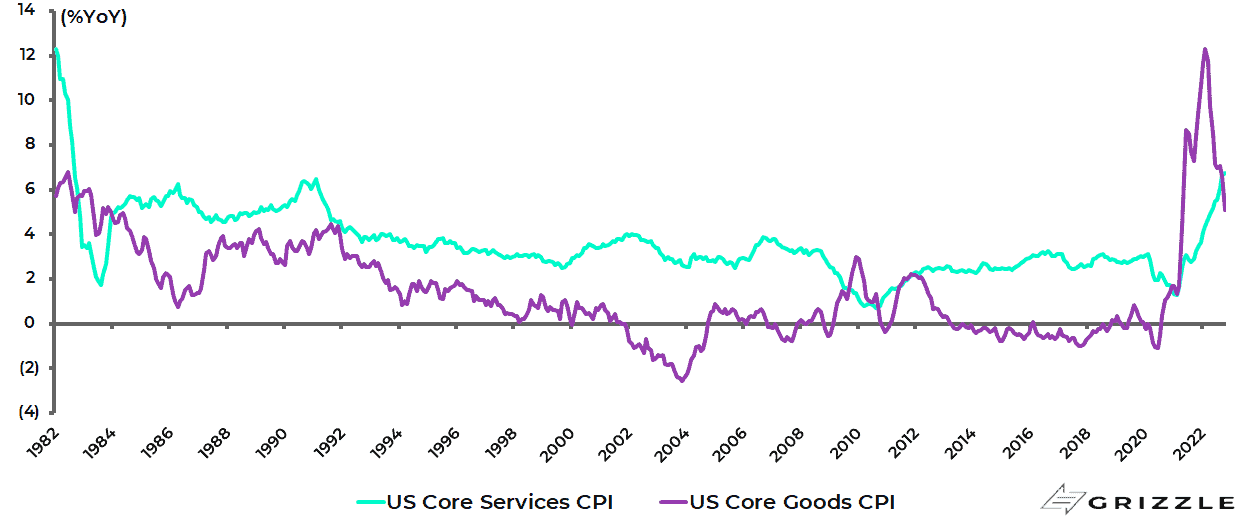
True, there is continuing evidence of spreading service sector inflation even if goods inflation increasingly looks like it has peaked.
Core goods CPI inflation slowed from 6.6% YoY in September to 5.1% YoY in October, while core services CPI inflation rose from 6.1% YoY in August to 6.7% YoY in both September and October, the highest level since August 1982.
US core goods CPI and core services CPI inflation
Source: Bureau of Labor Statistics
Still last month only nine of the 36 main CPI categories saw an acceleration in the year-on-year inflation rate while 27 categories decelerated.
By contrast, 17 categories accelerated in September.
Meanwhile, assuming a conservative 0.0% MoM growth going forward, US CPI inflation will slow to 6.4% YoY in December.
US CPI inflation projection assuming 0.0%MoM going forward
Source: Bureau of Labor Statistics
Are we Already in an Earnings Recession?
If the CPI report has been greeted euphorically by investors, as hopes revive for the peaking-out-of-inflation trade, the stock market still has to contend next year with the lagged effects of this year’s aggressive monetary tightening.
In this respect, the market has not discounted an increasingly likely US recession in 2023 in terms of earnings forecasts.
There are some important points to make about the trend in US corporate profits which are best captured in the macro measure of profits from the national accounts.
On the face of it, the data for the second quarter was healthy with non-financial corporate profits before tax rising by 9.8% YoY, and 3.9% YoY after tax.
However, the interesting point from a sector standpoint is that if profits from the energy sector are excluded, based on S&P500 data, profits actually fell by 4% YoY in 2Q22 compared with the 6.3% YoY growth in total S&P 500 earnings, according to FactSet.
As for 3Q22, where 91% of the S&P500 companies have so far reported earnings, FactSet estimate is that, if the energy sector is excluded, the S&P500 would be reporting a 5.3% YoY decline in earnings rather than a 2.2% growth in total earnings.
S&P Profits are at Risk of a Reversion
The other more important point is that S&P 500 profits have diverged significantly on the upside above the macro measure of profits in the national accounts.
S&P 500 annualised as reported earnings have risen by 104% since 4Q20, while the macro measure of non-financial corporate profits after tax is up only 33% over the same period.
US NIPA nonfinancial corporate profits after tax and S&P500 as reported EPS (2011-2022)
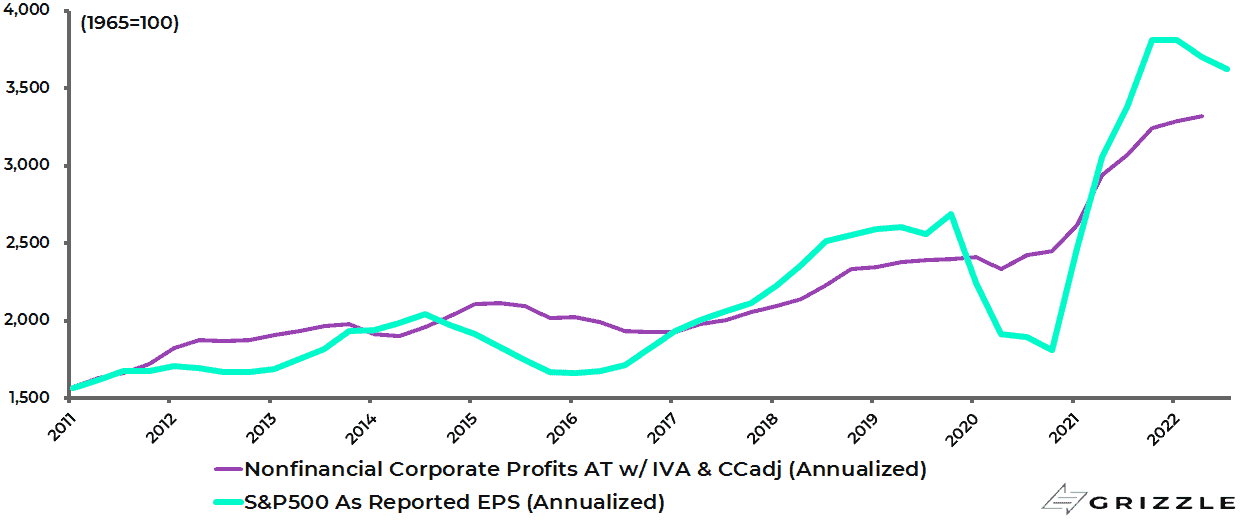
Note: Annualised data. Shaded areas = recessions. US nonfinancial corporate profits after tax with inventory valuation and capital consumption adjustment. Source: Bureau of Economic Analysis, S&P Dow Jones Indices
For example, the annualised nonfinancial corporate profits after tax peaked in 4Q97 and subsequently declined by 36% to bottom in 4Q01.
While S&P500 annualised EPS peaked in 3Q00 and then fell by 54% to the low reached in 4Q01.
US NIPA nonfinancial corporate profits after tax and S&P500 as reported EPS (log scale since 1947)
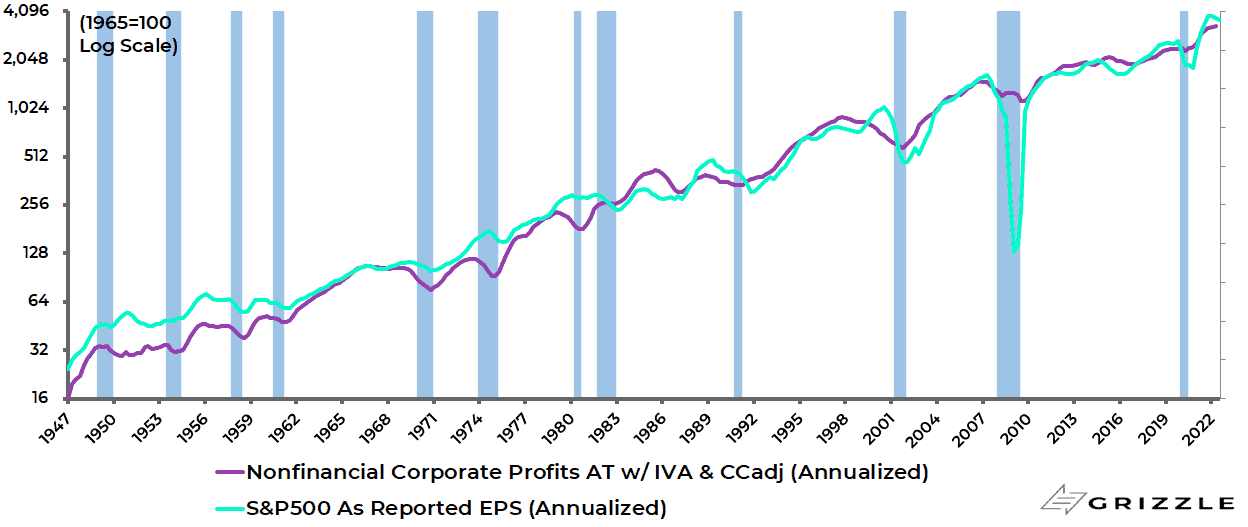
Note: Annualised data. Shaded areas = recessions. US nonfinancial corporate profits after tax with inventory valuation and capital consumption adjustment. Source: Bureau of Economic Analysis, S&P Dow Jones Indices
Wall Street Estimates Only Account for the Stronger Dollar Not an Earnings Decline
If this is the backdrop for the growing risk to US earnings in coming quarters, the other practical point is that there have, as yet, been minimal earnings downgrades in the US, most particularly of the sort that would normally be expected in a recession.
It is worth noting that the S&P 500 universe’s 2022 and 2023 forecast earnings have been downgraded by only 1.9% and 4.8% respectively over the past three months, based on consensus data.
The other point has been the surging US dollar, with the US Dollar Index up 11.1% so far this year, and the resulting impact on corporate profits.
An estimated 40% of S&P500 revenues are derived from offshore.
Meanwhile, the average peak earnings downgrade in a three-month period has been 17% in the last four recessions.
S&P500 consensus forecast 12m forward EPS: 3-month revision

Note: Shaded areas = recessions. Source: IBES, Datastream, Jefferies
Is There a Path for the Fed to Get More Dovish?
So if the outlook is not so promising, there is room for more of a relief rally in the short-term if monetary tightening expectations have peaked, as now seems likely, most particularly in the lead up to year-end.
Meanwhile, it remains the case that the most logical way the Fed could justify a potential change to more doveish language, long before inflation reaches its 2% target, would be to focus on market-driven inflation expectations.
The argument would be that because there is now more evidence that long-term inflation expectations have been “re-anchored”, as a result of the hawkish Fed actions with 375bp of tightening so far this calendar year, there is now room for the Fed to ease up.
On this point, it is also worth noting that Fed Vice Chair Lael Brainard has of late become more chatty.
She made a speech in Chicago on 10 October, for example, which should be viewed as the commencement of an anticipated Fed narrative highlighting that monetary policy works with a lag.
In her speech, Brainard noted that previous rate hikes since March, together with anticipated future rate hikes, will slow the economy in ways that cannot be observed yet (see The Wall Street Journal article: “Two Fed Officials Make Case for Caution With Future Interest Rate Raises”, 10 October 2022).
But she also said that it will take some time for the cumulative tightening “to transmit throughout the economy and to bring inflation down”, while adding that the moderation in demand due to monetary policy tightening is “only partly realized so far”.
Brainard also cited some specifics that may lead to monetary tightening impacting the economy more quickly.
The most interesting was her reference to recent revisions to household income data.
She stated that recent revisions to personal income data imply that “the current stock of excess savings held by households is lower and has been drawn down more rapidly in recent quarters than had been previously estimated”.
Indeed, Brainard noted that, based on Fed staff estimates, “the revisions imply that the stock of excess savings held by households is about 25% lower, which may imply a more subdued pace of consumer spending going forward than had been projected”.
On this latter point, one simple way to measure excess household savings is to calculate the gap between US monthly personal savings during the pandemic and the pre-pandemic level in February 2020.
By contrast, the previous reported data released in late August, prior to the revision, showed that cumulative excess savings peaked at US$2.39tn in December 2021 and have since declined by US$242bn or 10% to US$2.15tn in July.
That means the revisions have lowered the stock of excess personal savings by 27% as of July.
US cumulative excess personal savings relative to pre-pandemic Feb-20 level
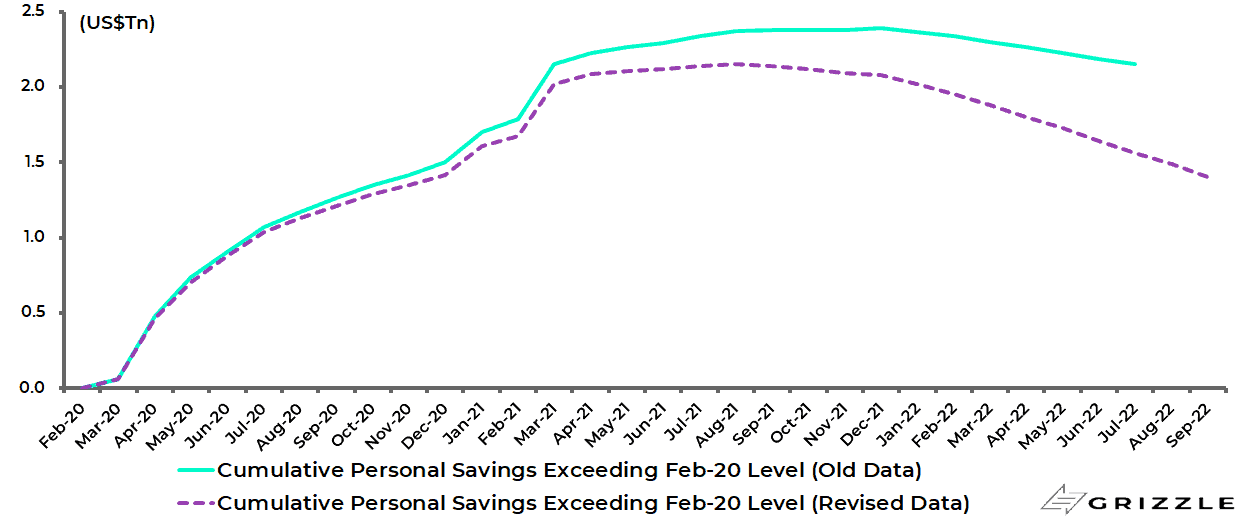
Source: Bureau of Economic Analysis
The US personal savings rate for July has also been revised down from 5.0% to 3.5%.
US personal savings rate
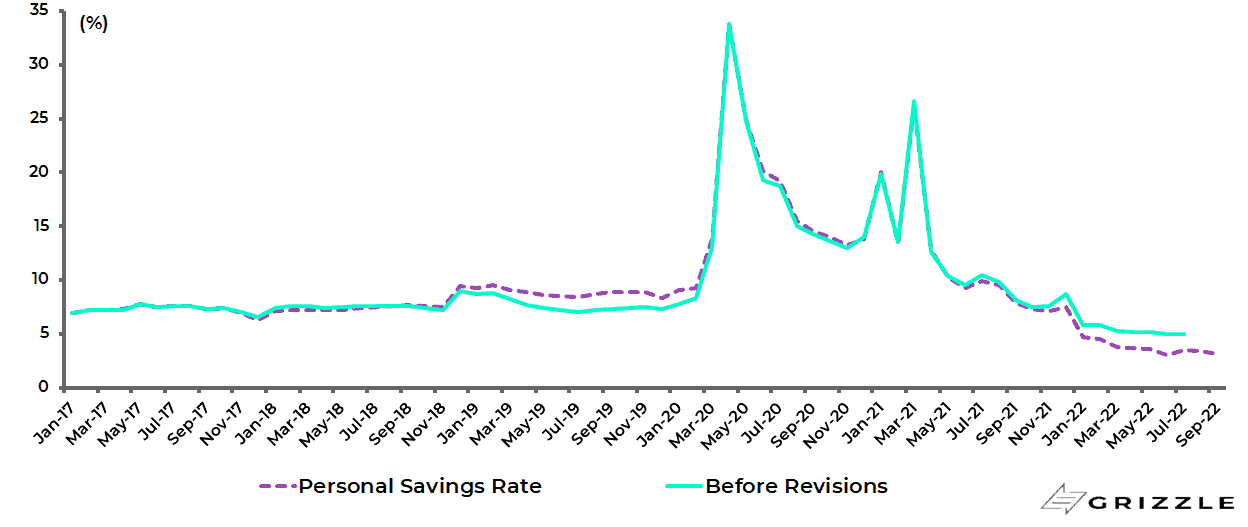
Source: Bureau of Economic Analysis
As for the August and September readings, based on the revised data, cumulative excess savings declined further to US$1.49tn in August and US$1.40tn in September, while the personal savings rate fell to 3.1% in September.
About Author
The views expressed in Chris Wood’s column on Grizzle reflect Chris Wood’s personal opinion only, and they have not been reviewed or endorsed by Jefferies. The information in the column has not been reviewed or verified by Jefferies. None of Jefferies, its affiliates or employees, directors or officers shall have any liability whatsoever in connection with the content published on this website.
The opinions provided in this article are those of the author and do not constitute investment advice. Readers should assume that the author and/or employees of Grizzle hold positions in the company or companies mentioned in the article. For more information, please see our Content Disclaimer.
