
World stock markets remain optimistic for a U.S.-China trade deal this quarter. The key question perhaps is whether it is a “mini deal”, which is the consensus, or something more substantial. More substantial is a deal where the existing tariffs are dropped. Almost no one is expecting this but this is what should happen should a deal be agreed since the tariffs were put in place by the Trump administration as leverage in a negotiation.
By contrast, a deal where existing tariffs are maintained while threatened tariffs are delayed yet again is much less positive. This is because it will endorse the current consensus that globalization has peaked, and that Sino-U.S. relations are set for long-term deterioration.
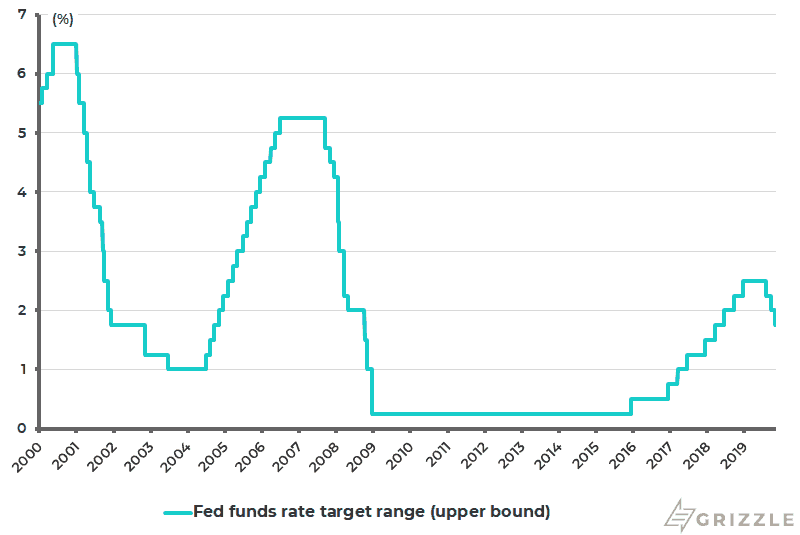
Meanwhile, it would also be positive, especially for Asia and emerging market equities, if the deal contains a currency component, as discussed here last week (‘Will China and the U.S. Sign a ‘Currency Pact’?’, Nov. 5, 2019). Meanwhile, the Federal Reserve cut rates last month by 25bp to 1.50-1.75%, meaning 75bp of cuts so far in this monetary easing cycle which began at the end of July (see following chart).
Fed Funds Rate Target Range
Source: Federal Reserve
A Rapidly Expanding Balance Sheet
If Fed rate cuts have helped risk-on sentiment, a perhaps more important positive for the liquidity focused is the resumption of Fed balance sheet expansion. The first difference, in terms of the latest Fed initiative, compared with self-described quantitative easing, is that the Fed will be buying only short-term Treasury bills at a rate of US$60 billion a month, in addition to overnight and term repo operations.
The second difference is that the new policy, which the Fed is not officially describing as quanto easing, but rather as “organic growth” and “reserve management purchases”, is open-ended both in terms of time and scale. Thus, the Fed announced on Oct. 11 that it would “purchase Treasury bills at least into the second quarter of next year”. The New York Fed planned to purchase Treasury bills at an initial pace of approximately US$60 billion per month, starting Oct. 15, and will adjust “the timing and amounts of reserve management Treasury bill purchases and repo operations as necessary to maintain an ample supply of reserve balances over time”.
If this is the official explanation, the overwhelming view of investors is that the latest operation is quanto easing in all but name. Indeed the Fed balance sheet will be expanding much more rapidly in coming months than the ECB balance sheet even though the policy in Europe is formally described as quantitative easing. The ECB announced on Sept. 12 that net purchases will be restarted under its asset purchase programme at a monthly pace of €20 billion starting from Nov. 1, while the deposit facility rate was cut by another 10bp to a negative 0.50%.
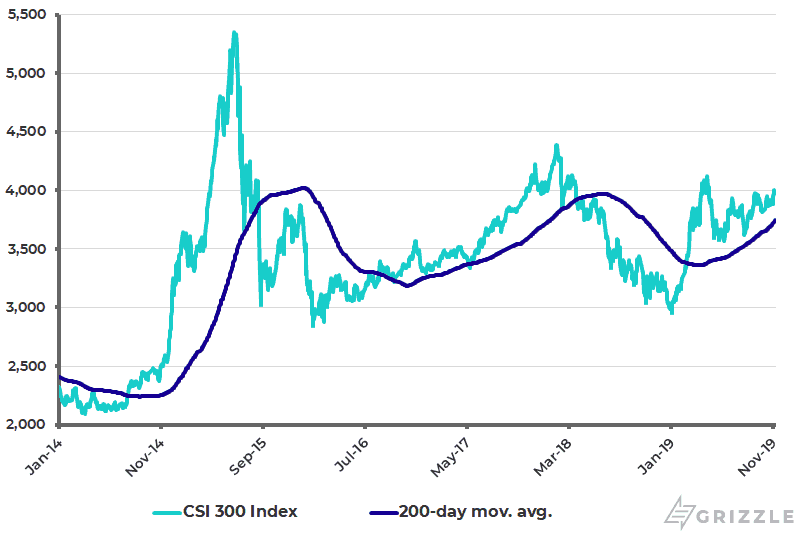
China CSI 300 Index
Source: Bloomberg
Watch Asian Stocks to Outperform
Meanwhile, there is clearly a case for Asian equities to outperform if the ideal combo of trade deal and currency agreement are delivered, even if the latter is only a verbal commitment. On this point, I also maintain the view that the core of Asian equities, namely Chinese equities, saw their low when the China A share market bottomed on Jan. 4 at 2,936 on the CSI300 Index (see previous chart). This is despite the latest data showing slowing economic growth.
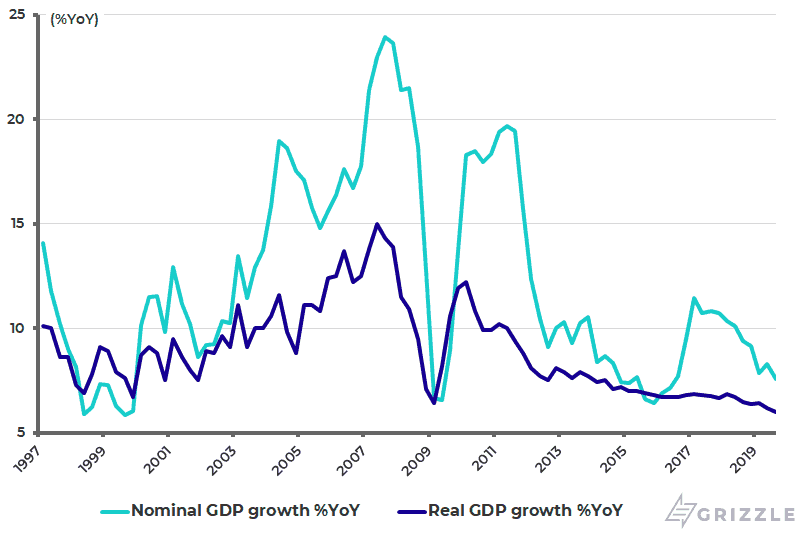
Thus, China real GDP growth slowed from 6.2% YoY in 2Q19 to 6.0% YoY in 3Q19 and is down from 6.6% YoY in 2018 to 6.2% YoY in the first three quarters of 2019, the lowest level since 1990. While, more importantly, nominal GDP growth slowed from 8.3% YoY in 2Q19 to 7.6% YoY in 3Q19, the slowest growth since 2Q16 (see following chart). In this respect, the bottom-up story in China is better than the top-down one as the quality of growth has improved given the lack in this cycle so far of the usual steroid stimulus.
China Nominal and Real GDP Growth
Source: CEIC Data, National Bureau of Statistics
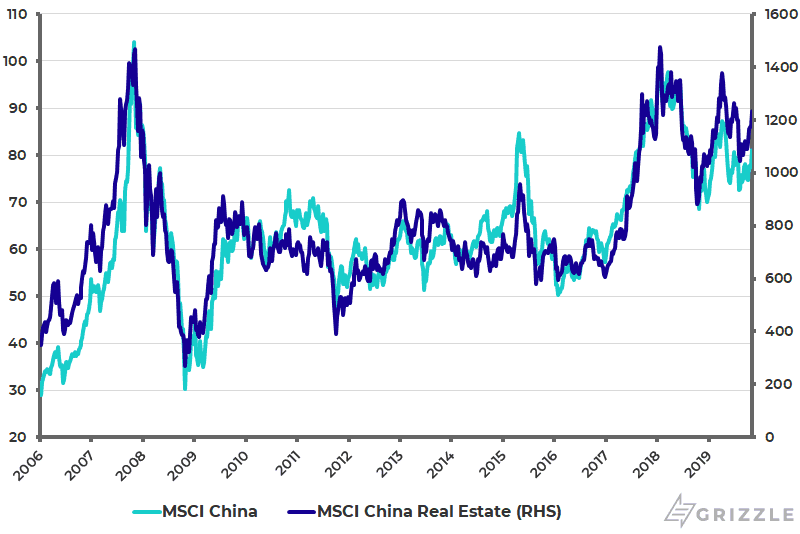
A positive view on China equities normally requires China property stocks to be outperforming. The correlation between the MSCI China Index and the MSCI China Real Estate Index has been 0.89 since 2006 (see following chart). It is, therefore, encouraging that the MSCI China Real Estate Index has risen by 19.3% year-to-date, compared with a 14.1% gain in the MSCI China Index.
MSCI China and MSCI China Real Estate Index
Source: Datastream, Bloomberg
Meanwhile, China’s latest macro data has highlighted again the surprising resilience of residential property investment. Residential real estate investment rose by 14.9% YoY in the first nine months of this year and was also up 14.9% in September, compared with 13.7% YoY August (see following chart).
China Residential Real Estate Investment Growth
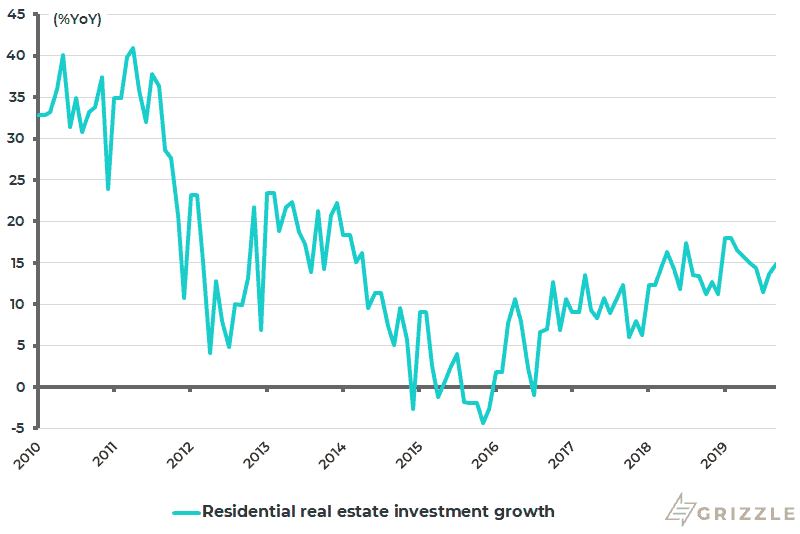
Note: Derived from reported year-to-date data. Source: CEIC Data, National Bureau of Statistics
By contrast, manufacturing and private sector fixed asset investment growth, both impacted by the trade and tariff issues, slowed to 2.5% YoY and 4.7% YoY, respectively, in January-September, down from 9.5% YoY and 8.7% YoY in the whole of 2018 (see following chart).
China Manufacturing Sector and Private Sector Fixed Asset Investment Growth
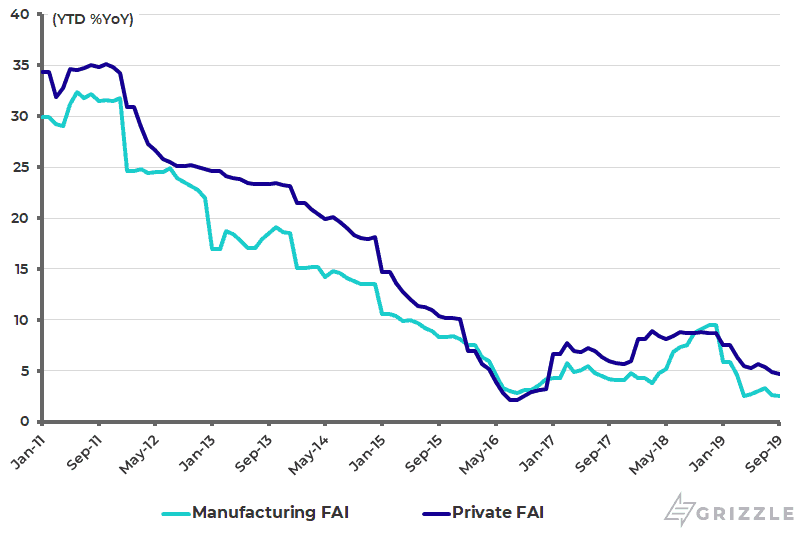
Source: CEIC Data, National Bureau of Statistics
The other point is that consumption related data remains healthy. Nationwide disposable income per capita rose by 8.8% YoY in nominal terms and 6.1% YoY in real terms in 1Q-3Q19, with urban per capita disposable income rising by 7.9% YoY in nominal terms and 5.4% YoY in real terms (see following chart).
China Real per Capita Disposable Income Growth
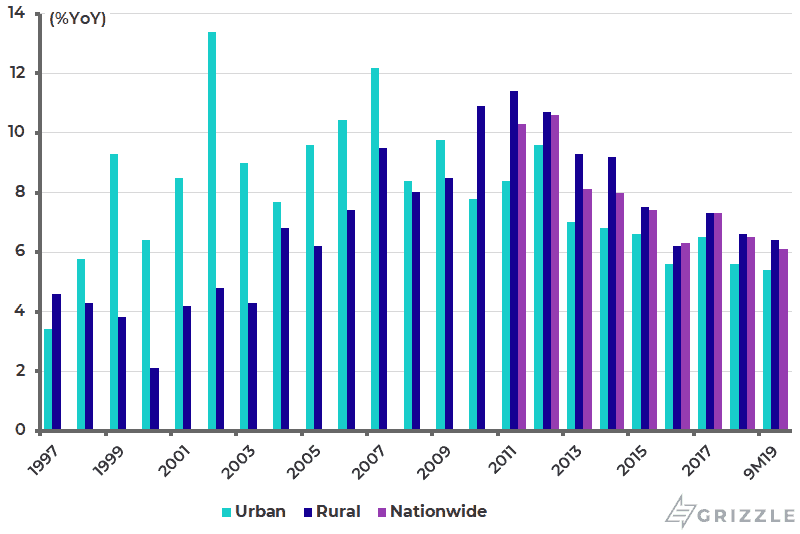
Source: National Bureau of Statistics
About Author
The views expressed in Chris Wood’s column on Grizzle reflect Chris Wood’s personal opinion only, and they have not been reviewed or endorsed by Jefferies. The information in the column has not been reviewed or verified by Jefferies. None of Jefferies, its affiliates or employees, directors or officers shall have any liability whatsoever in connection with the content published on this website.
The opinions provided in this article are those of the author and do not constitute investment advice. Readers should assume that the author and/or employees of Grizzle hold positions in the company or companies mentioned in the article. For more information, please see our Content Disclaimer.
