

Given Donald Trump’s recent criticism of Federal Reserve policy of late, Fed chairman Jerome Powell made a politically astute speech at Jackson Hole in late August which was interpreted by markets as dovish, primarily because he stated that “we have seen no clear sign of an acceleration (in inflation) above 2%”.
Jackson Hole is the annual get together of central bankers. That said, there has been minimal impact in terms of any change in monetary tightening expectations, with the Fed funds futures still discounting 75bp of rate hikes by the end of 2019.
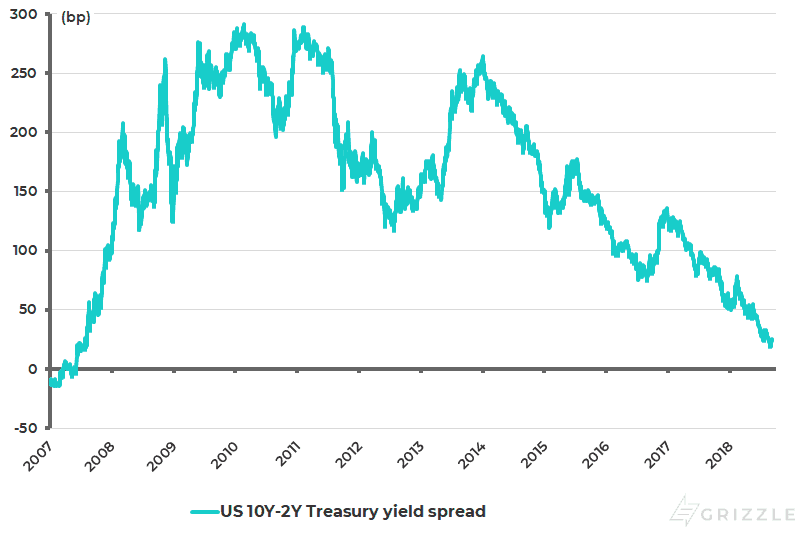
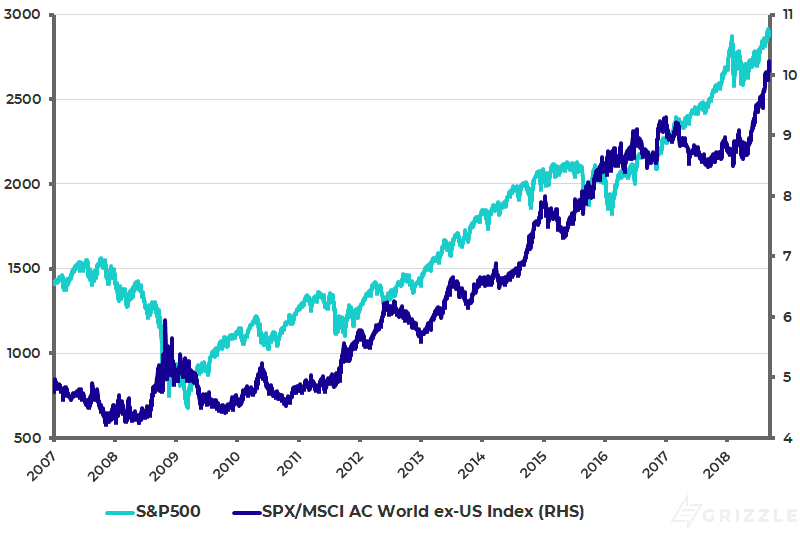
But what has happened of late is that the yield curve has continued to flatten. The spread between the 10-year and the 2-year Treasury bond yields has declined from 33bp at the start of August to a low of 19bp on August 24 and is now 24bp (see following chart). Meanwhile, the S&P500 finally made a new high for the year on August 24, breaking the previous one in late January (see following chart). This demolishes the previous working hypothesis here, namely that January was the high for this cycle.
US Stock Market Strong Compared to Rest of the World
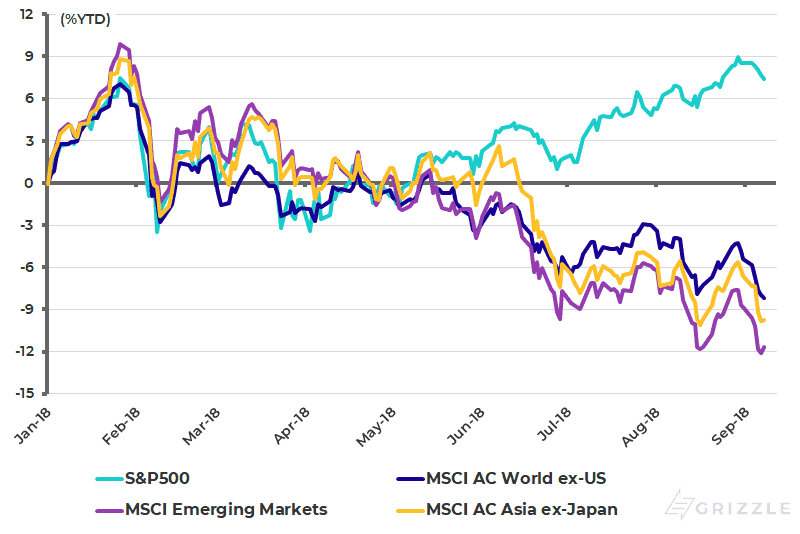
It has also served to highlight further the contrasting performance year to date between the American stock market and the rest of the world, most particularly since the start of the second quarter when the US dollar rally hit Asia and emerging markets. The S&P500 has risen by 7.4% year-to-date and is up 11.2% since April 2. By contrast, the MSCI Emerging Markets Index has fallen by 11.7% in US dollar terms year-to-date and is down 12.5% since the start of April (see following chart).
US yield curve (10Y-2Y Treasury bond yield spread)
S&P500 relative to MSCI AC World ex-US
S&P500, Asia ex-Japan and Emerging Markets 2018 year-to-date performance
The Buyback Frenzy
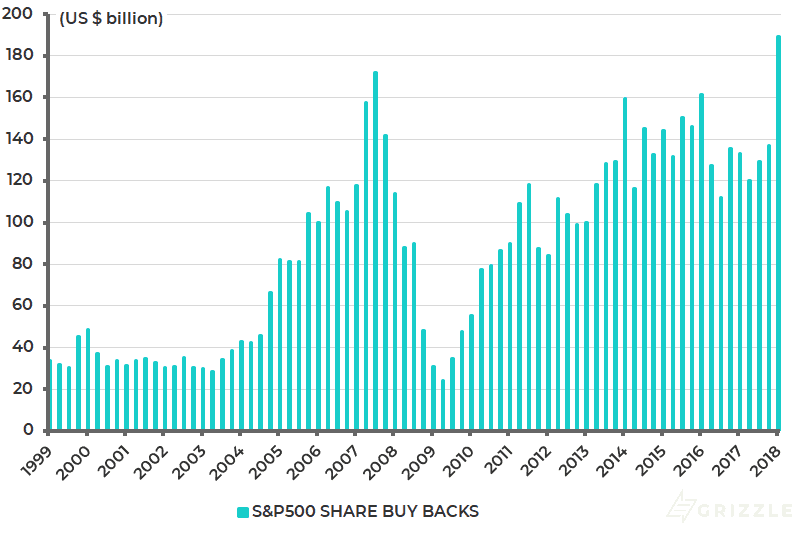
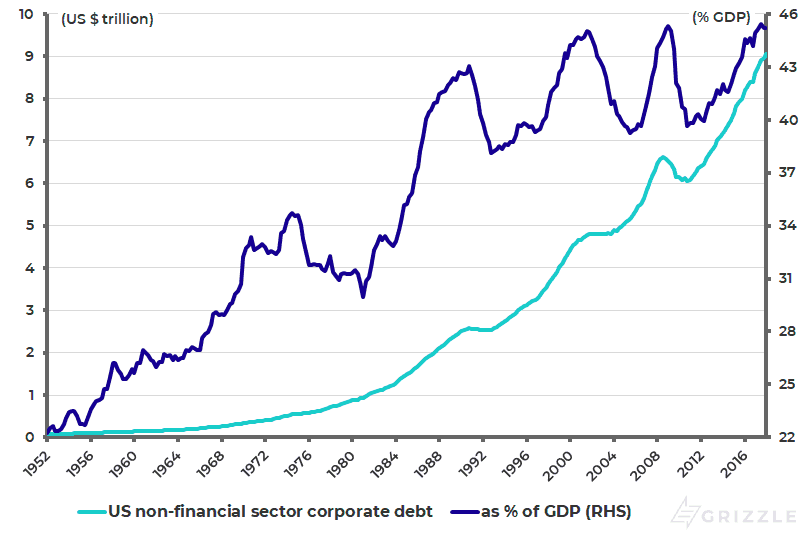
The US equity rally has been driven primarily by the boost to earnings from tax reform and the related phenomenon of surging share buybacks. The share buyback data has been extraordinary. S&P500 actual reported share buybacks rose by 42%YoY to a record US$189 billion in 1Q18, higher than just before the global financial crisis ten years ago (see following chart). As usual most of these buybacks are financed by borrowed money even though corporate debt in the US is at an all-time high (see following chart). While there were another US$410 billion worth of buyback announcements in 2Q18, according to Bloomberg.
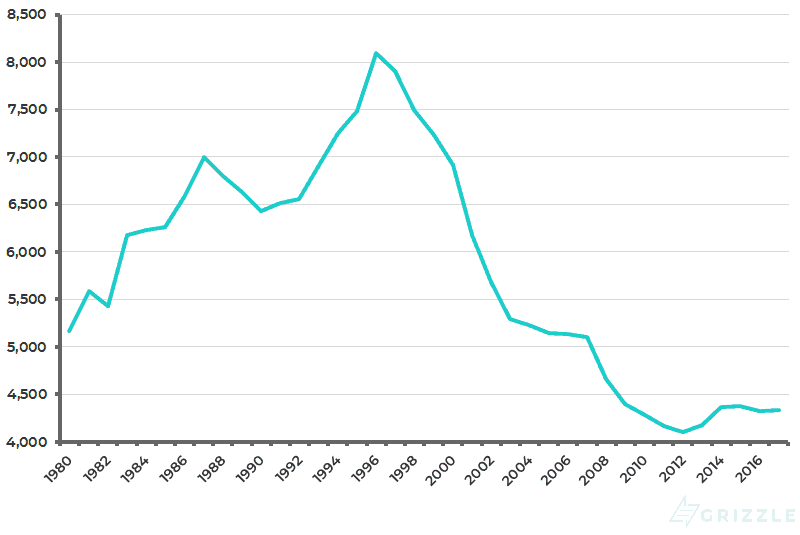
This buyback frenzy has revived attention of late on the shrinking nature of America’s equity market, and the related and ongoing boom in private equity. The number of listed domestic companies in the US has declined from a peak of 8,090 in 1996 to 4,336 in 2017 (see following chart). Indeed the biggest buyer of shares in the past ten years has been corporates themselves. Meanwhile, this year promises to be a record year for share buybacks, breaking the previous annual record of US$589 billion in 2007.
S&P500 share buybacks
US non-financial sector corporate debt
Number of listed domestic companies in the US
It Comes Down to the US Dollar
As to the question of whether America continues to outperform Asia and emerging markets, it will rest primarily on the action in the US dollar. As previously written here, this will be strongly influenced by whether the macro combo of fiscal easing and monetary tightening continues.
Fiscal easing seems a certainty with the Donald which means monetary policy will be the key variable. This is why the action in the US yield curve represents the best hope for Asia and emerging market investors looking for renewed outperformance. For the yield curve is the best signal that the Fed is unlikely to raise rates as much as anticipated. Implicit in the above view is the assumption that the main reason for Asian and emerging market underperformance is US dollar strength rather than any systemic crisis. Turkey is not viewed as systemic while China is not seen as in crisis.
Increase in Savings For Proprietors Not Employees
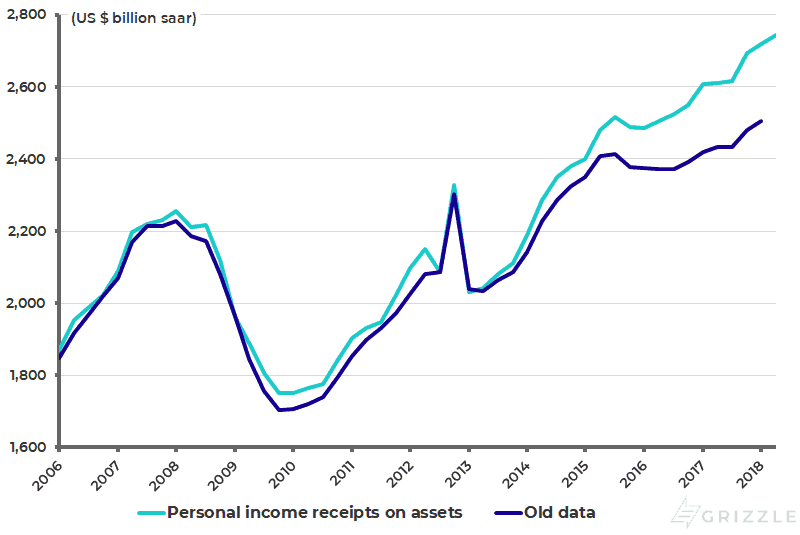
Meanwhile, a word is due on the revisions to US data discussed here recently, which has resulted in a significant increase in the household savings rate from 3.2% to 6.8%. This is because this data does not reflect a surge in labour compensation and a resulting decline in US inequality. The reason why is that the increase in the savings rate is primarily driven by upward revisions in the proprietors’ income and investment income categories rather than by an increase in the compensation of employees.
Thus, US personal savings in 1Q18 were revised up from an annualized US$481 billion to US$1.09 trillion, while disposable income was revised up by US$516 billion or 3.5% to US$15.3 trillion. Within this aggregate, proprietors’ income and investment income (interest and dividend income) were revised up by US$129 billion and US$215 billion (or 9.1% and 8.6%) respectively to US$1.55 trillion and US$2.72 trillion. By contrast, compensation of employees was revised up by only US$101 billion or 1% to US$10.7 trillion (see following charts).
Revision in 1Q18 US personal income and savings
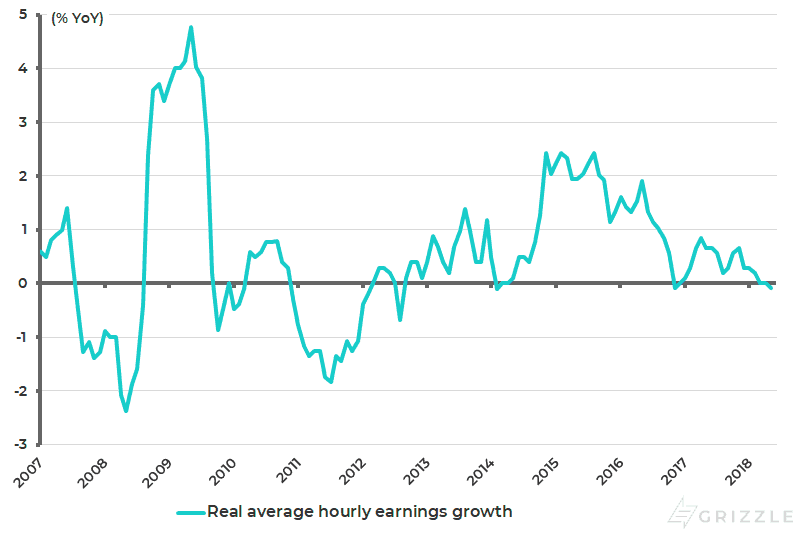
As a result, proprietors’ income and investment income contributed to 74% of the revision in total personal income, compared with only 22% contributed by compensation of employees. The other point, of course, as regards compensation for labour is that the pickup in US average hourly earnings growth in the past two years looks even less impressive when viewed in real rather than nominal terms. Thus, US real average hourly earnings declined by 0.1%YoY in July and are up only an annualized 0.3% over the past two years (see following chart).
Revision in US proprietors’ income

Revision in US personal investment income (interest income and dividend income)
US real average hourly earnings growth
The views expressed in Chris Wood’s column on Grizzle reflect Chris Wood’s personal opinion only, and they have not been reviewed or endorsed by Jefferies. The information in the column has not been reviewed or verified by Jefferies. None of Jefferies, its affiliates or employees, directors or officers shall have any liability whatsoever in connection with the content published on this website.
The opinions provided in this article are those of the author and do not constitute investment advice. Readers should assume that the author and/or employees of Grizzle hold positions in the company or companies mentioned in the article. For more information, please see our Content Disclaimer.