
The change of stance by the Federal Reserve has naturally raised hopes that the U.S. economic cycle has achieved a so-called “benign equilibrium”, where growth slows to the trend level of around 2% after the tax-driven sugar rush of 2018 and a recession continues to be avoided.
Such a view would also lead to hopes that the U.S. stock market has just gone through a mid-cycle correction with further upside ahead. This is certainly a possibility; though the base case here remains that the S&P500 is now right at the top of the trading range. This is why earnings results for the first quarter will be critical.
It is worth focusing again on what drove the “Powell pivot”, since the change in the Fed’s language and overall stance last quarter has clearly been much more pronounced than the change in U.S. economic data.
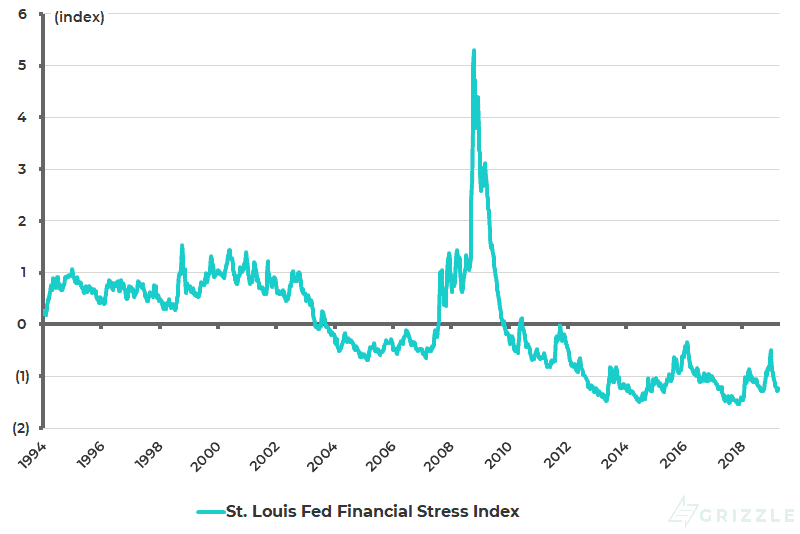
The answer seems to be that the surge in U.S. credit spreads in December was the main trigger. This allowed the doves at the Fed to refocus on a deterioration in financial conditions. Thus, the St. Louis Fed’s Financial Stress Index had its biggest increase in 4Q18 since the 2008 global financial crisis. The index rose from -1.28 at the end of 3Q18 to -0.50 at the end of 4Q18, but has since declined to -1.27 in early April (see following chart). The index is a measure of U.S. financial stress, comprising 18 market indicators and including six yield spreads.
St. Louis Fed Financial Stress Index
Source: Federal Reserve Bank of St. Louis
Tracking the Spreads
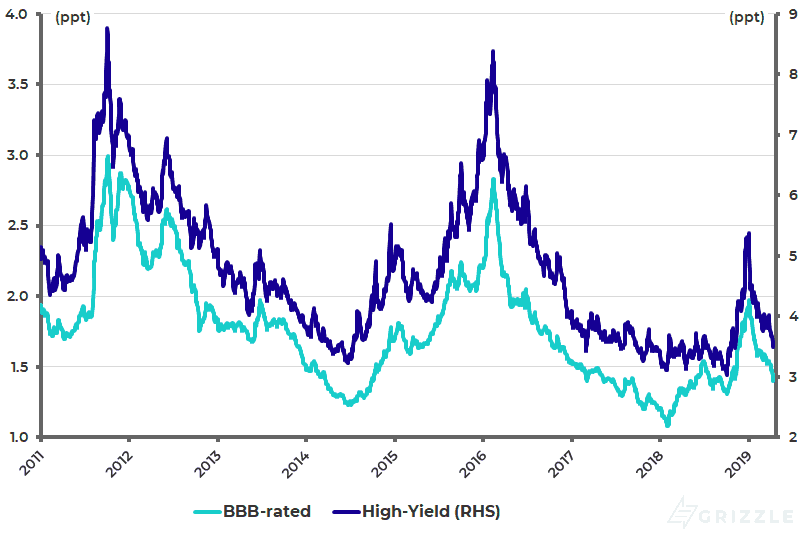
The change in Fed stance has certainly led to a significant tightening in credit spreads at a time when the yield curve has continued to flatten. The BBB-rated corporate spread rose from 131bps in early October 2018 to a high of 197bps in early January, but has since declined to 140bps.
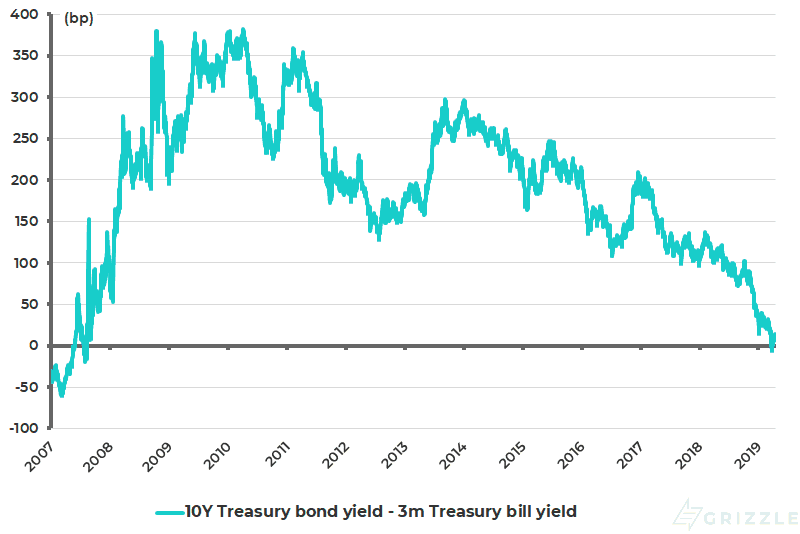
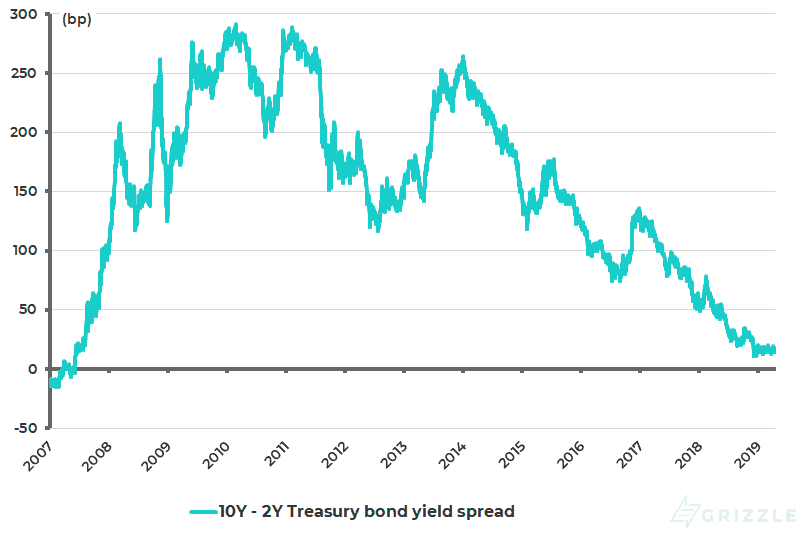
Similarly, the U.S. high-yield corporate spread rose from 303bps in early October to 537bps in early January, and has since declined to 349bps (see following chart). Meanwhile, the yield curve actually inverted towards the end of last quarter, as noted here last week. The spread between the 10-year Treasury bond yield and the three-month Treasury bill yield declined from 33bps at the end of 2018 to a negative 5bps in late March, the lowest level since August 2007, though it has since risen to 14bps (see following chart). Still, the spread between the 10-year Treasury bond yield and the 2-year, also closely watched by investors, has still not inverted. The 10-year yield spread over the 2-year Treasury bond yield has remained broadly unchanged year-to-date and is now 17bp (see following chart).
Bloomberg-Barclays U.S. corporate bond spreads
Source: Bloomberg
U.S. 10-year Treasury bond yield less 3-month Treasury bill yield
Source: Bloomberg
U.S. 10-year Treasury bond yield less 2-year Treasury bond yield
Source: Bloomberg
Any Expectation of Monetary Tightening?
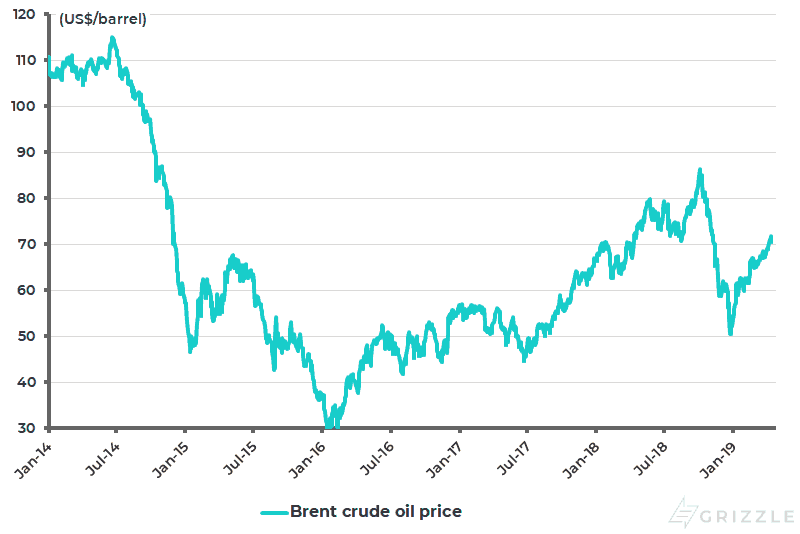
This yield curve action last quarter has further re-enforced the case for an end to U.S. monetary tightening. The Fed, after such a “volte-face”, is now at risk of being whipsawed if there is a combination of a trade deal, stronger U.S. data and a pickup in inflation. On this point, it is also the case that the fall in inflation expectations in recent months was in significant part influenced by the sharp correction in the oil price in 4Q18, which was in turn triggered by Trump’s U-turn on Iranian oil sanctions. On this point, a constructive view is maintained here on oil price, which has now rebounded by 43% from its low of US$49.93/barrel late last year to US$71.55 (see following chart).
Brent crude oil price
Source: Bloomberg
Any renewed pickup in monetary tightening expectations, if it happens, is likely to prove extremely short-lived in the sense that such a development will likely trigger a stock market sell-off and a related rise in the U.S. dollar. In this sense, while there is certainly the potential for a renewed pickup in monetary tightening expectations, there is much less likelihood of an actual rate hike. For the system clearly cannot handle higher interest rates given the overall debt levels. That is why Jerome Powell has been forced to abandon further normalization and why the ECB and the Bank of Japan seemingly cannot engage in any contraction of their balance sheets whatsoever.
China’s Economy Looking a Lot More Stable
Meanwhile, compared with the retreat from monetary policy normalization witnessed in the G7 world in the past quarter, the situation in China looks remarkably stable, most particularly in the context of the bearish sentiment among investors that prevailed towards China at the start of this year. Monetary policy in China also remains remarkably orthodox when compared with the G7 world.
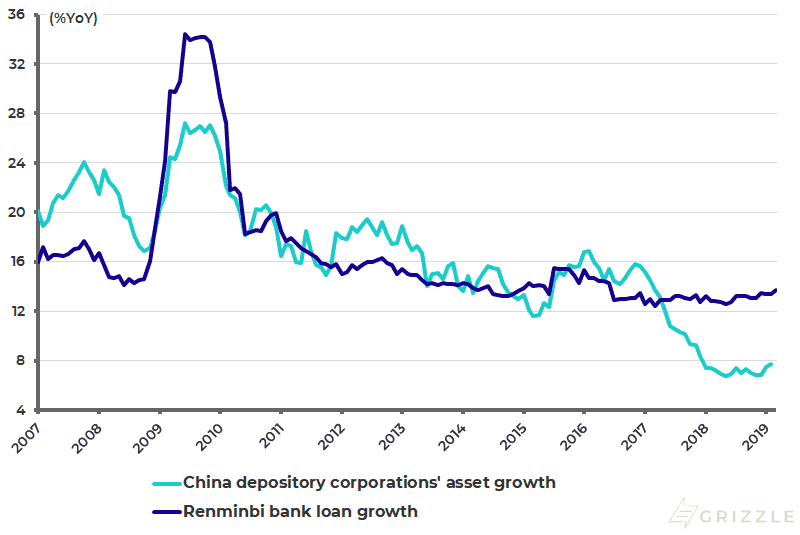
The end of deleveraging, combined with the continuing lack of a steroid stimulus, means that the recovery in Chinese credit growth is likely to be U-shaped rather than V-shaped. In this respect, the initial evidence of a pickup in Chinese deposit-taking banks’ asset growth remains encouraging given that the sharp decline in this data series was the best indicator of the severity of the shadow banking squeeze, as banks have been forced to bring loans back on balance sheets since 2016. Depository corporations’ asset growth slowed from 16.9% YoY in February 2016 to 6.8% in December 2018, and has since risen to 7.7% in February 2019 (see following chart).
China depository corporations’ asset growth and renminbi loan growth
Source: PBOC, CEIC Data
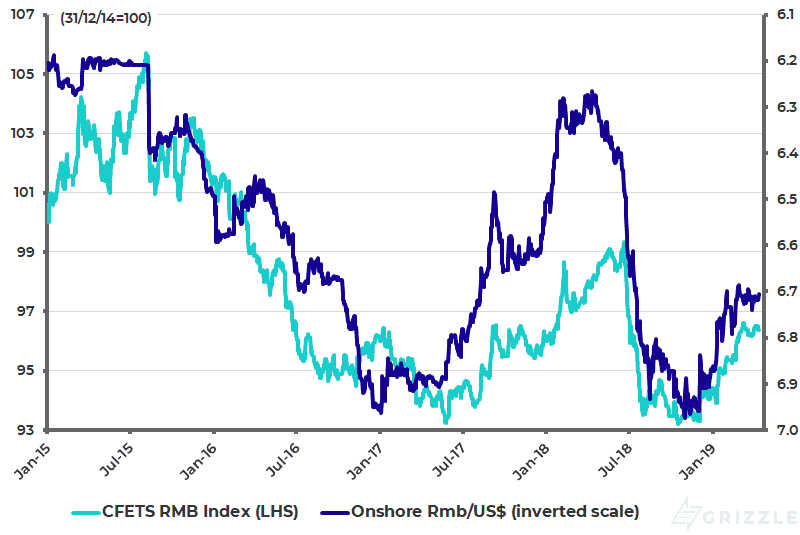
China CFETS trade-weighted RMB Index and renminbi/US$ (inverted scale)
Note: Renminbi trade-weighted index based on CFETS basket of 24 currencies against the renminbi. Source: CFETS, PBOC, Bloomberg
As for the Chinese currency, China bears’ predictions of a renminbi collapse have yet again proved mistaken as the People’s Bank of China has continued to track broadly the trade-weighted index. The trade-weighted Renminbi Index has risen by 2.1% so far in 2019, while the renminbi has appreciated by 2.5% against the U.S. dollar over the same period (see previous chart).
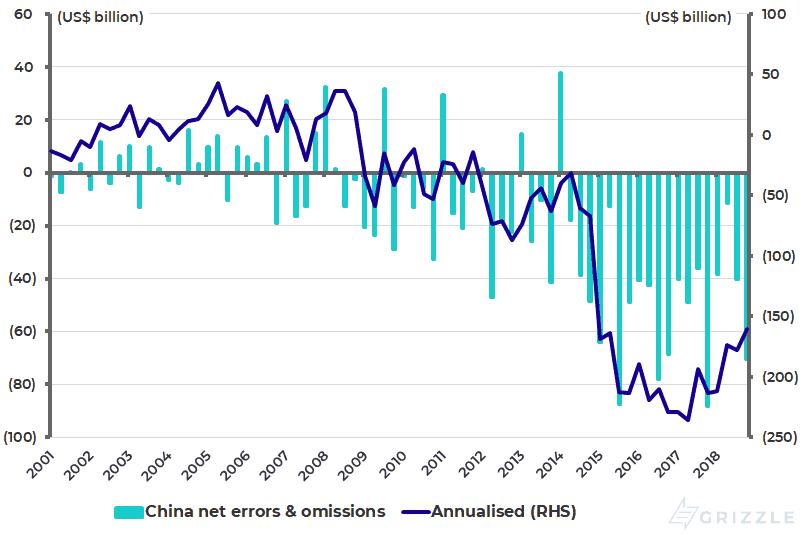
Meanwhile, control of the capital account remains as critical as ever for China’s command economy. On that subject, it is worth highlighting that the latest released net errors and omissions data for 4Q18, or what does not add up in the balance of payments, shows a rising deficit. Thus, the net errors and omissions deficit rose to US$70 billion in 4Q18, up from a recent low of US$11 billion in 2Q18 and US$40 billion in 3Q18, though it is down by 20% YoY from US$88 billion in 4Q17 (see following chart).
On an annual basis, the net errors and omissions deficit has declined by 30% over the past two years from a peak of US$229 billion in 2016 to US$160 billion in 2018.
The benefit of the doubt continues to be given to Beijing to manage the issue of controlling capital outflows. But it remains a critical point given that the command-economy model cannot work with an open capital account.
China balance of payments: Net errors & omissions
Source: State Administration of Foreign Exchange (SAFE)
About Author
The views expressed in Chris Wood’s column on Grizzle reflect Chris Wood’s personal opinion only, and they have not been reviewed or endorsed by Jefferies. The information in the column has not been reviewed or verified by Jefferies. None of Jefferies, its affiliates or employees, directors or officers shall have any liability whatsoever in connection with the content published on this website.
The opinions provided in this article are those of the author and do not constitute investment advice. Readers should assume that the author and/or employees of Grizzle hold positions in the company or companies mentioned in the article. For more information, please see our Content Disclaimer.
