
The new Federal Reserve chairman’s first FOMC meeting this week, and subsequent press conference, has confirmed that Jerome Powell is not an egghead obsessed with macroeconomic models. This is refreshing given the highly academic nature of his predecessors Janet Yellen and Ben Bernanke, and suggests that he will alter his view on the economy based on the reported data rather than theoretical projections of the future.
This also suggests that the so called ‘dot plots’, which are nothing more than the forecasts of individual Fed governors, should become less important. But for now the financial markets will still pay attention to those dots, most particularly as they are showing three interest rate hikes next year on top of the three projected this year (though that three has nearly become four).
Fed Dot Plot: FOMC Members’ Fed Funds Rate Forecasts

Note: Based on midpoint of Fed funds rate target range. Red dots denote median forecasts. Source: Federal Reserve
The ‘Dot Plot’ Would Bury the Indebted US Consumer
This would take the upper end of the federal funds rate target range to 3.0% by the end of 2019. That is a level of interest rates which Grizzle has a hard time believing will happen given the sensitivity of the indebted American economy to higher interest rates.
But if short-term rates really go that high, the view here is that the yield curve will by then have inverted in terms of short-term interest rates moving above long-term interest rates. On this point, the yield curve has already begun to flatten again of late. The spread between the 10-year and the 2-year Treasury bond yields has declined from a recent high of 78bp reached in mid-February to 54bp (see following chart).
US Yield Curve (10Y – 2Y Treasury Bond Yields)
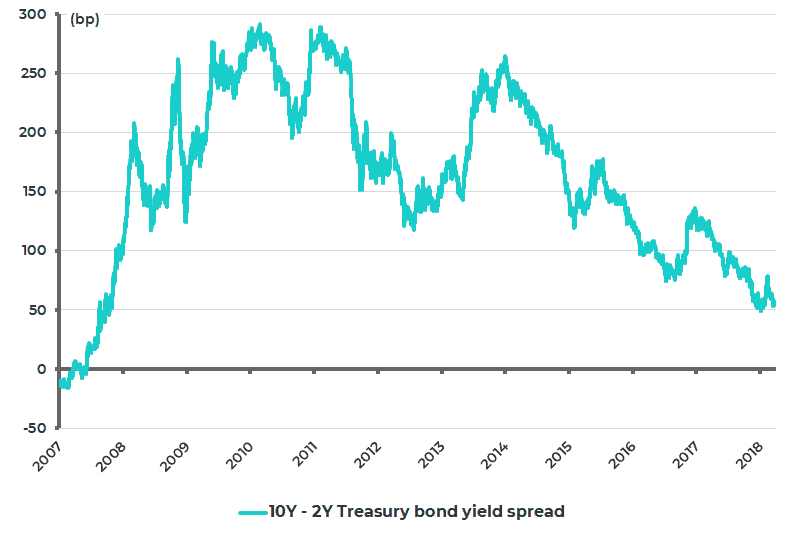
Source: Bloomberg
Weak US Dollar Despite Hawkish Fed
Meanwhile, it remains remarkable how the US dollar still cannot rally given the relative optimism on the American economy suggested by this week’s Fed statement and given the hawkish signal provided by the ‘dots’ with the US Dollar Index declining by 0.9% since the Fed rate hike on Wednesday. This is a further sign that investors should continue to assume for now that the US dollar remains weak (see following chart), which remains a positive for emerging markets.
US Dollar Index

Source: Bloomberg
It is also not bullish for the dollar that the US Dollar Index speculative net futures position has switched from a net short of 5,787 contracts in late January to a net long of 847 contracts in the week ended 13 March (see following chart).
CFTC US Dollar Index (DXY) Speculative Net Futures Positions
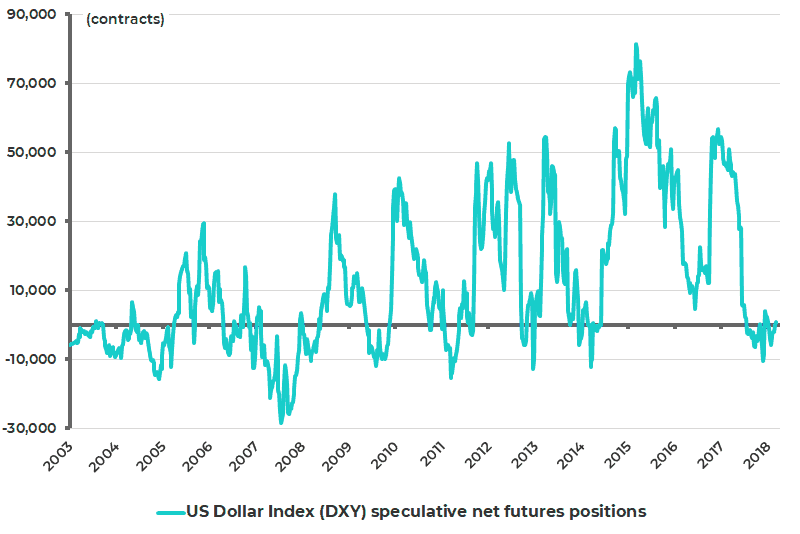
Source: US Commodity Futures Trading Commission (CFTC), Bloomberg
Rate Hikes Have Been a Catalyst for Gold
It is also interesting how the gold price rallied by US$21 on the day of the Fed rate hike. This follows a pattern whereby gold sells off prior to monetary tightening and then rallies on the news. Indeed gold has rallied on each of the six rate hikes that have taken place so far in this Fed tightening cycle which began in December 2015 (see following chart).
Gold Bullion Price and Fed Rate Hikes
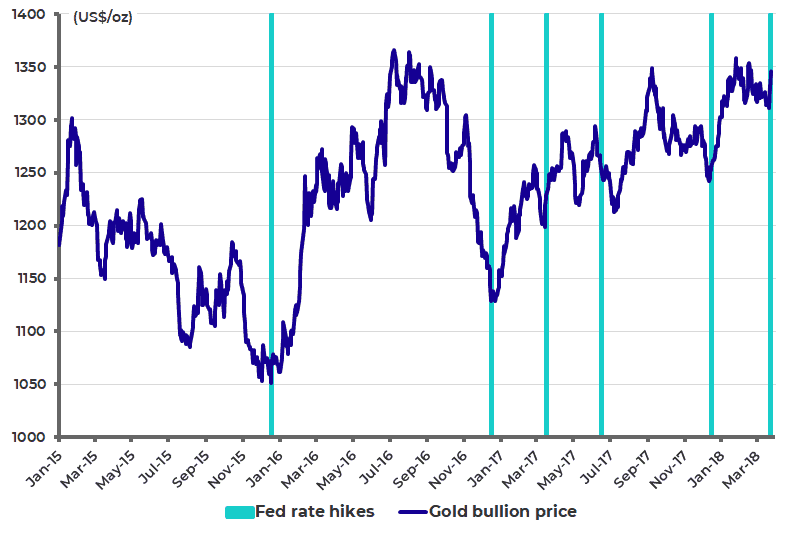
Source: Federal Reserve, Bloomberg
The obvious reason for gold’s relative resilience this year despite rising Fed tightening forecasts is the weak dollar and the growing belief that inflation is returning. But, whatever the reason, Grizzle remains positive on the yellow metal.
If inflation really returns, an outcome about which skepticism is maintained here, gold will clearly do well. If it does not, then Fed policy is going to reverse dramatically since there is no way the indebted American economy can handle the higher level of real interest rates implied by the above mentioned ‘dots’.
US Economic Data — Examining Case For Monetary Tightening
Meanwhile, the latest American wage data has, for now at least, eased monetary tightening concerns. This is because wage growth slowed. US average hourly earnings rose by 2.6%YoY in February, down from a downward revised 2.8%YoY in January (see following chart).
US Average Hourly Earnings Growth and Change in Nonfarm Payrolls
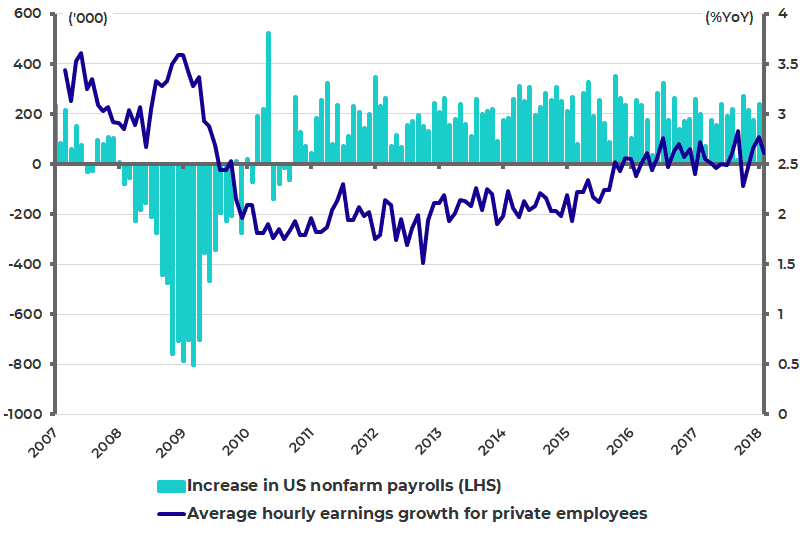
Source: US Bureau of Labour Statistics
It is also a positive that job growth picked up markedly and the non-participation rate declined. Nonfarm payrolls increased by 313,000 jobs in February, up from 239,000 in January — the biggest increase since July 2016.
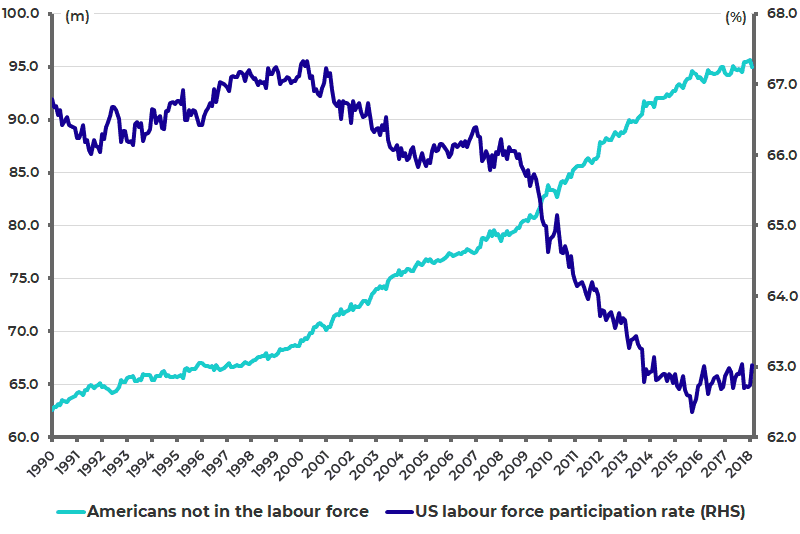
Also, Americans not in the labour force declined from a record 95.7 million in January to 95.0 million in February, while the labour force participation rate increased from 62.7% to 63% (see following chart). This is a reminder that there remains considerable slack in the American labour market despite all the talk of “full employment”.
US Labour Force Participation Rate and Americans Not in the Labour Force
Source: US Bureau of Labour Statistics
The next average hourly earnings growth data will be reported on April 6th. Meanwhile, if a guess had to be made as to the timing of the next monetary tightening scare, it would be the announcement of core CPI for March due on April 11th. This is because the base effect suggests that this month should show the greatest statistical evidence in 2018 of a pickup in price pressures.
Core CPI declined by 0.1% MoM in March 2017, the only monthly decline in 2017. As for the February CPI inflation, core CPI inflation remained unchanged at 1.8% YoY, still below the Fed’s 2% target (see following chart).
US Core CPI Inflation

Source: Bureau of Labour Statistics
Investors should also be aware that offshore dollar rates have picked up in recent weeks resulting in a widening of the so-called ‘Ted spread’ — which is the spread between the 3-month Libor and the 3-month Treasury bill rate.
The 3-month Libor has risen by 58bp so far this year to 2.27%, while the Ted spread has risen from a low of 18bp in mid-November to 56bp (see following chart).
The best guess as to why this is happening is due to the dollar funding pressures created by the repatriation of offshore US corporate cash as a result of the one-off tax rate offered to American corporates under the Trump administration’s tax reform to incentivize them to repatriate the estimated US$2.6 trillion of cash they hold offshore.
Three-month USD Libor and the TED Spread
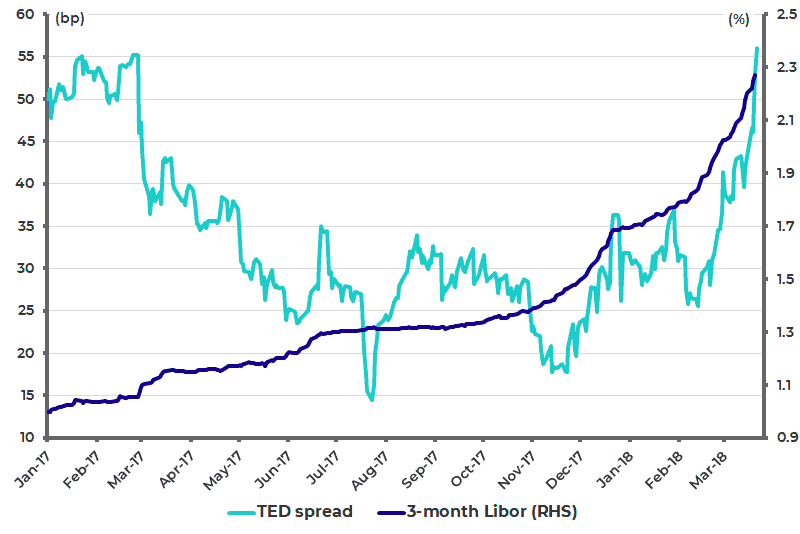
Note: TED spread = 3-month USD Libor – US 3-month T-bill rate. Source: Bloomberg
The views expressed in Chris Wood’s column on Grizzle reflect Chris Wood’s personal opinion only, and they have not been reviewed or endorsed by Jefferies. The information in the column has not been reviewed or verified by Jefferies. None of Jefferies, its affiliates or employees, directors or officers shall have any liability whatsoever in connection with the content published on this website.
The opinions provided in this article are those of the author and do not constitute investment advice. Readers should assume that the author and/or employees of Grizzle hold positions in the company or companies mentioned in the article. For more information, please see our Content Disclaimer.