

Wage Growth Unsettles ‘Goldilocks’ Market Era
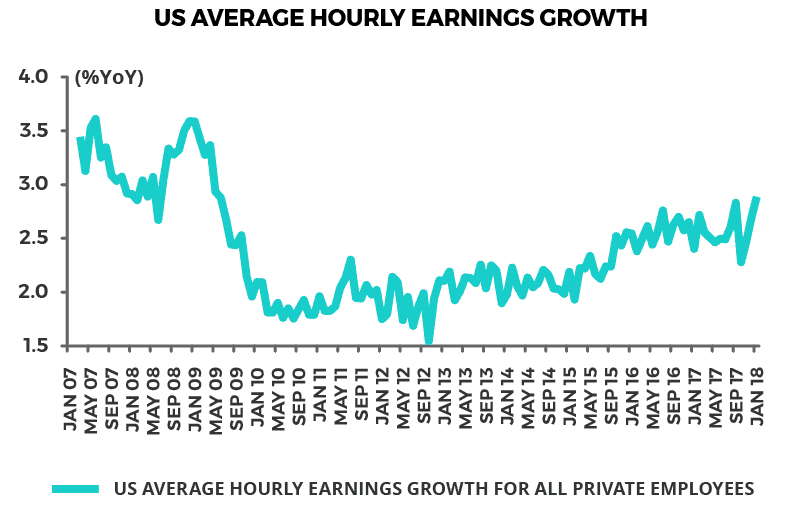
The stock market correction over the past week is the biggest since January 2016. It was triggered by one strong wage number. U.S. average hourly earnings growth accelerated from 2.7%YoY in December to 2.9%YoY in January — the highest level since May 2009 (see following chart).
So, this is the strongest YoY wage growth since the global financial crisis. This has raised concerns that the era of ‘goldilocks’ may be ending where growth has been neither ‘too hot’ nor ‘too cold’, allowing interest rates to remain at the ultra-low levels that have prevailed since the financial crisis.
Homogeneous Market Structure: Momentum ‘Algo’ Trading Machines + ETF-ication
If a strong wage print has been the trigger for falling share prices, there has also been evidence in the past week of machine-driven selling accentuating the decline. One interesting point about the sell-off is the way volatility has surged in an American stock market that has become dominated in recent years by machine-driven “algo” trading and related passive investment strategies or pseudo passive strategies otherwise known as “smart beta”.
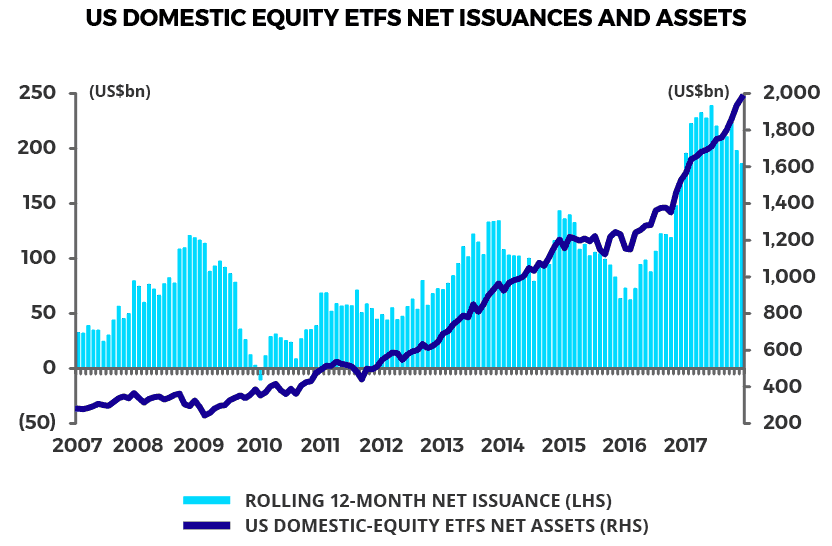
Such passive investment strategies, also known as “indexation”, involve investors buying indices as opposed to individual stocks, a trend further encouraged by the explosive growth in recent years of exchange traded funds (ETFs). Net issuance of U.S. domestic-equity ETFs has risen from US$38.5 billion in 2010 to US$186 billion in 2017, while assets of domestic-equity ETFs have surged by an annualized 23% over the same period to US$1.98 trillion at the end of 2017 (see following chart).
Volatility Upheaval – A Harbinger of What Awaits If Strong Inflation Returns
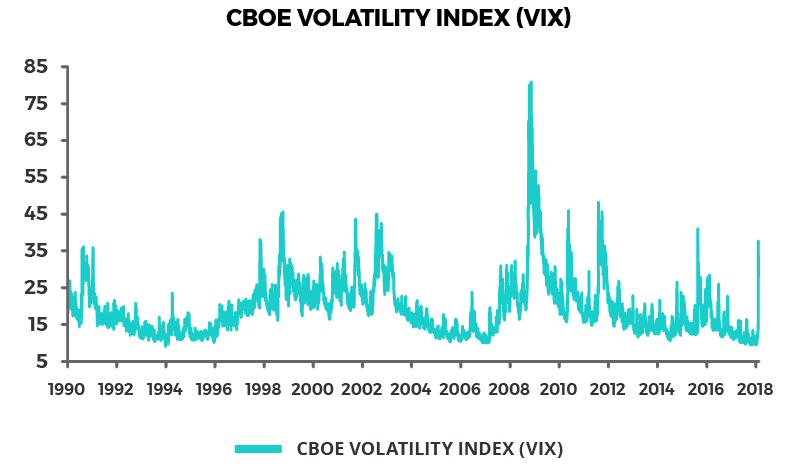
Thus the VIX, which is the data point monitored by Wall Street to measure stock market volatility, surged from a recent record closing low of 9.1 on November 3 and a level of 13.5 last Thursday (the day before the wage number was released) to a closing peak of 37.3 and an intraday high of 50.3 this week (see following chart). While this week’s surge in “vol” is so far nothing like the spike to 173 seen on the VIX during the October 1987 crash when the Dow Jones Industrial Average fell by 26% in two days, it’s still a reminder of how high “vol” could go if there was real evidence of a return of inflation leading to much higher interest rates.
There is no such evidence as yet even though the wage number has increased such concerns. Core CPI inflation in America was only 1.8%YoY in December. The other point about the October 1987 crash, which has real relevance today, is that the sell-off was in some respects mechanical in the sense that it was exacerbated by an unwind of so-called “portfolio insurance”, a popular investment strategy at that time. The same risk is repeated today, albeit on a dramatically larger scale, by the dominance of machine-driven trading in an American stock market where machines are estimated to account for as much as 80% of daily stock market trading.
This creates the risk that when a correction does happen it will feed on itself in a negative feedback loop. Since the machines are all probably programmed with the same momentum investing formula, the risk is that a trend change is exacerbated on the downside. This is precisely what has now begun to happen with the S&P 500 down by 8.8% since peaking on January 26. The difficulty is that it’s hard to weigh the risk of this “Terminator effect” because no one has ever seen a previous market cycle dominated to this extent by machines.
ETF-Induced Market Socialism
It’s also the case that the commoditization of equity investment represented by ETFs, and the related illusion of liquidity that results, further accentuates this risk. It is further the case that the indexation trend ultimately amounts to a form of investor socialism. This is because more and more money flows into products mirroring the same index, such as the S&P500. This means everybody is buying the same stocks.
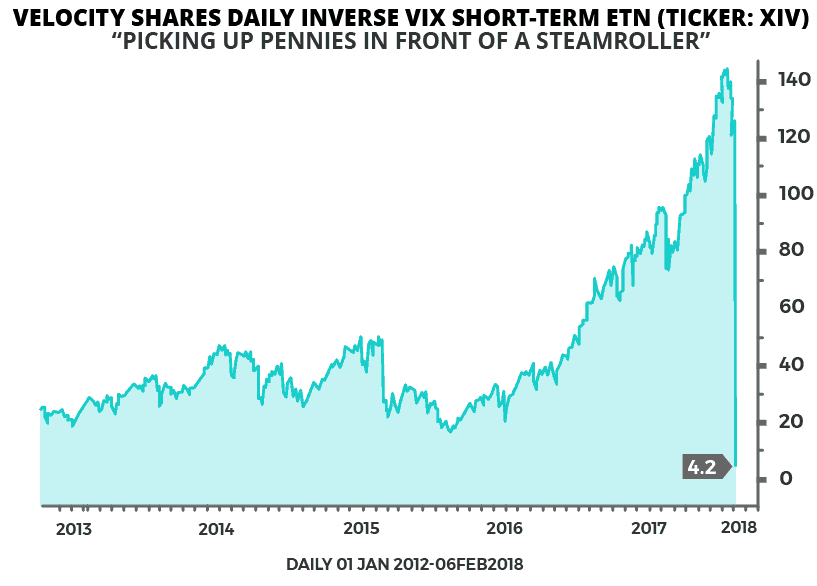
This ultimately makes no sense since valuations become super extended, which is why the S&P500 was trading at an all-time high price to sales ratio before the correction. This is why socialism makes no more sense in investing than in real life. Meanwhile the record low in volatility was reached last November, a level lower than even in the boom “risk on” era prior to the 2008 financial crisis. That this was the case suggests strongly that the machines were accentuating the collapse in “vol” by investing in so-called “short vol” strategies, following the longstanding Wall Street tradition of “picking up pennies in front of steamrollers”. This is an easy way of making money until it isn’t which is why two short “vol” exchange traded notes (ETNs) blew up this week.
The views expressed in Chris Wood’s column on Grizzle reflect Chris Wood’s personal opinion only, and they have not been reviewed or endorsed by Jefferies. The information in the column has not been reviewed or verified by Jefferies. None of Jefferies, its affiliates or employees, directors or officers shall have any liability whatsoever in connection with the content published on this website.
The opinions provided in this article are those of the author and do not constitute investment advice. Readers should assume that the author and/or employees of Grizzle hold positions in the company or companies mentioned in the article. For more information, please see our Content Disclaimer.