
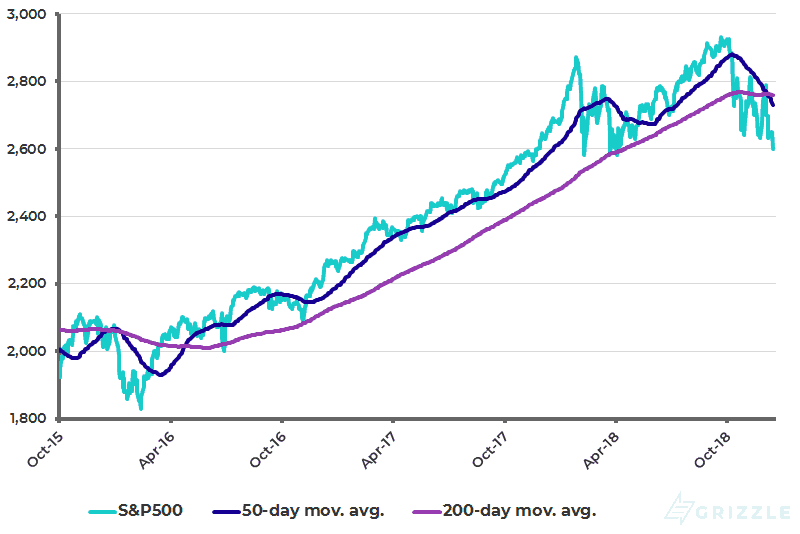
Wall Street remains in corrective mode despite hopes of the normal rally into year-end, with the S&P500 now down 11.6% from the September peak (see following chart).
On this point, there was an interesting article in The Wall Street Journal recently focusing on the continuing optimism of U.S. analysts’ earnings forecasts (“Optimism Is Great, But Some Believe in the Impossible”, Dec. 1, 2018 by Justin Lahart). The article noted that analysts polled by S&P Global Market Intelligence now believe that earnings for stocks in the S&P500 will grow by 13.3% a year for the next three to five years. This compares with an average of 7% a year earnings growth for the past two decades and 4%YoY revenue growth over the same period.
S&P500
Source: Bloomberg
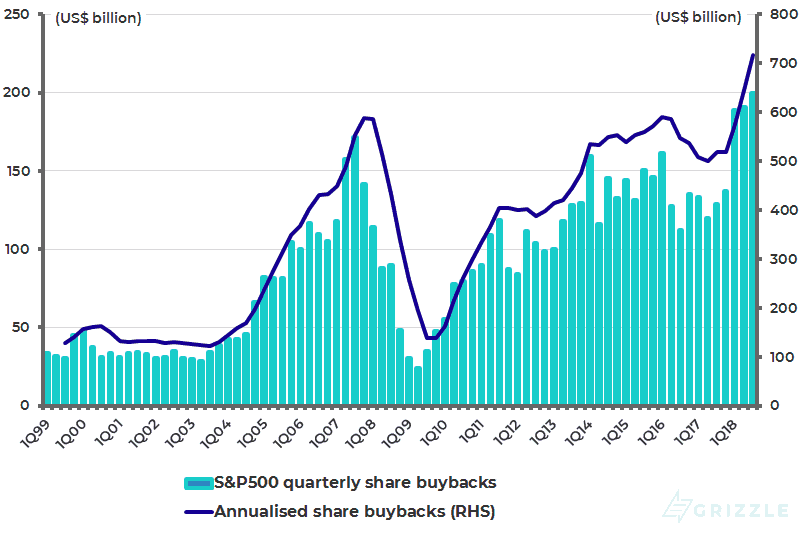
S&P500 share buybacks
Source: S&P Dow Jones Indices
The Real Threat to Profit Margins
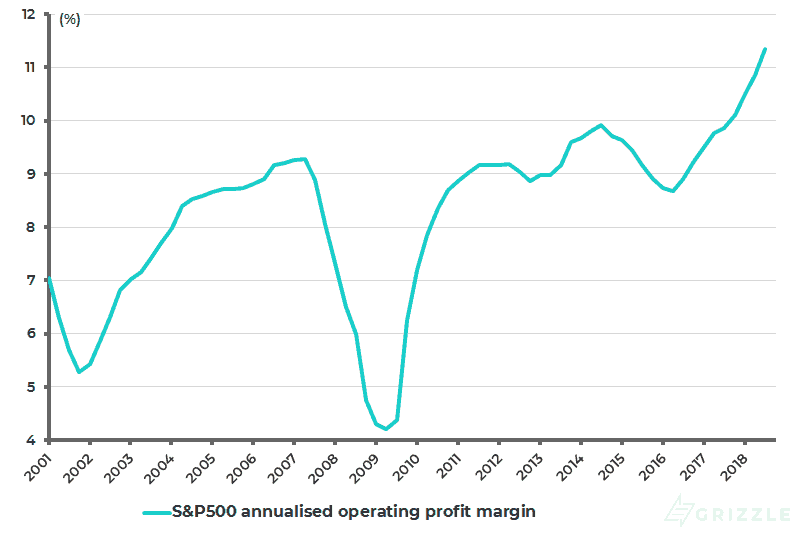
The above is interesting since, as the same article notes, even if revenues grow much faster than usual and share buybacks keep up the post-tax reform blistering pace (about US$580 billion in the first nine months of this year), the only way for earnings growth to rise by 13.3% annually would be for profit margins to rise significantly. But this seems unlikely in the extreme given that profit margins are at record highs even after adjusting for this year’s tax cuts. The S&P500 operating profit margin rose from 8% in 4Q15 to a record 12.1% in 4Q18 and an annualized 11.3% (see following chart). This is especially the case given the rising costs facing corporates, in particular rising wage costs.
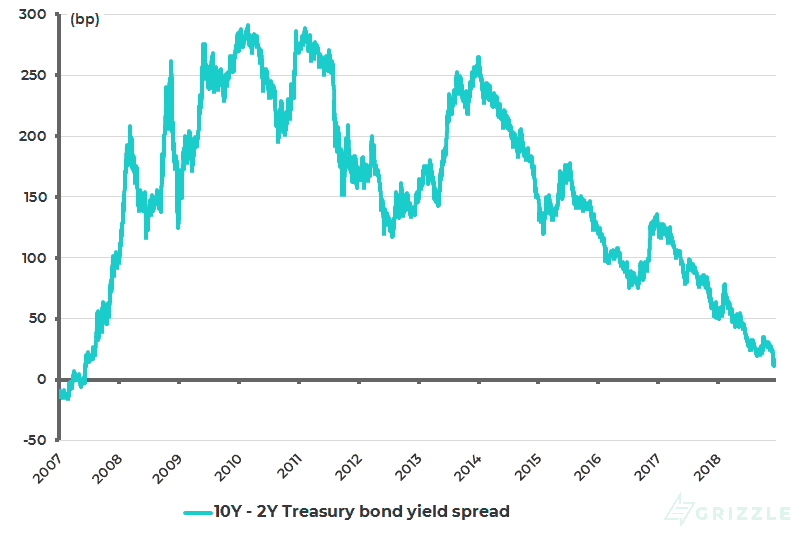
In this respect, the evidence of rising wage pressure is, for now, more of a threat to profit margins than a sign of coming inflation. This is why rising wages may be more of a threat to stocks than bonds, a signal also given by the continuing flattening of the yield curve.
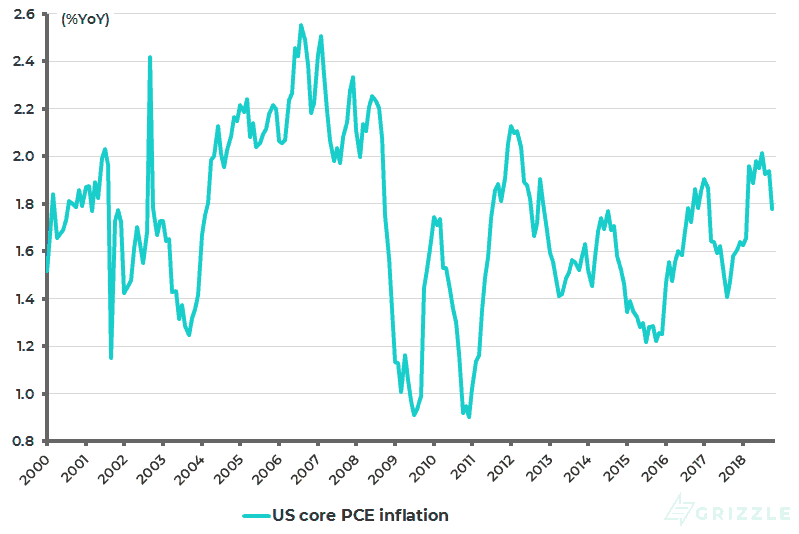
The spread between the 10-year and the 2-year Treasury bond yields declined from 25bp in late November to 11bp on Dec. 11, the lowest level since June 2007, and is now 16bp (see following chart). Meanwhile, US core PCE inflation has slowed from 2.0%YoY in July to 1.8% YoY in October, the lowest level since February (see following chart), and is running at a three-month annualized rate of only 1.1%.
S&P500 annualized operating profit margin
Source: S&P Dow Jones Indices
US yield curve (10Y-2Y Treasury bond yield spread)
Source: Bloomberg
US core PCE inflation
Source: US Bureau of Economic Analysis
Emerging Markets Outperforming Since October
All of the above is raising hopes that Asia and emerging markets’ underperformance has bottomed out relative to world stock markets, and indeed Asia and emerging markets have been outperforming since the end of October.
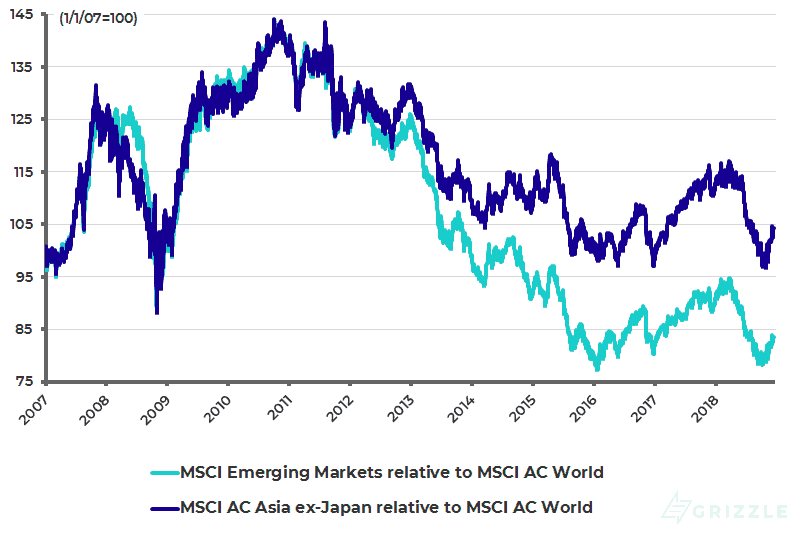
The MSCI AC Asia ex-Japan Index underperformed the MSCI AC World Index by 14% in the year to Oct. 30 and has since outperformed by 7.6%. While the MSCI Emerging Markets Index also underperformed the global benchmark index by 14% in the year to Oct. 8 and has since outperformed by 6.8% (see following chart). This is not just relative performance.
In absolute terms, the MSCI AC Asia ex-Japan and the MSCI Emerging Markets bottomed in late October and have since risen by 5.4% and 4.0% respectively, compared with a 1.1% decline in the MSCI AC World Index over the same period.
MSCI Emerging Markets and Asia ex-Japan relative to MSCI AC World Index
Source: CLSA, Datastream
Impact of Trump’s Economic Agenda
The above hope incorporates the view that there will only be two more rate hikes by the Federal Reserve in this tightening cycle, which is what is currently discounted by money market futures. Still, the risk to the above base case is, clearly, that the positive side of Trump’s economic agenda, namely tax cuts and deregulation, revives the animal spirits in the American economy. This is why a close eye needs to be kept on top-line revenue growth.
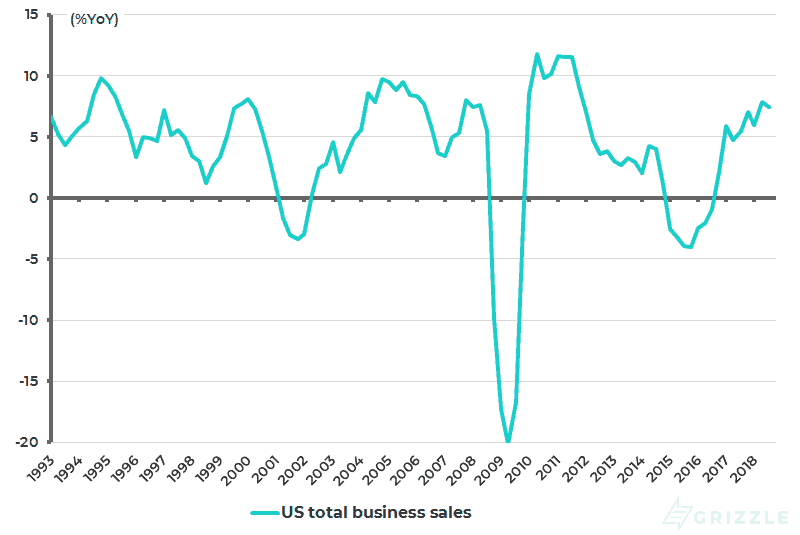
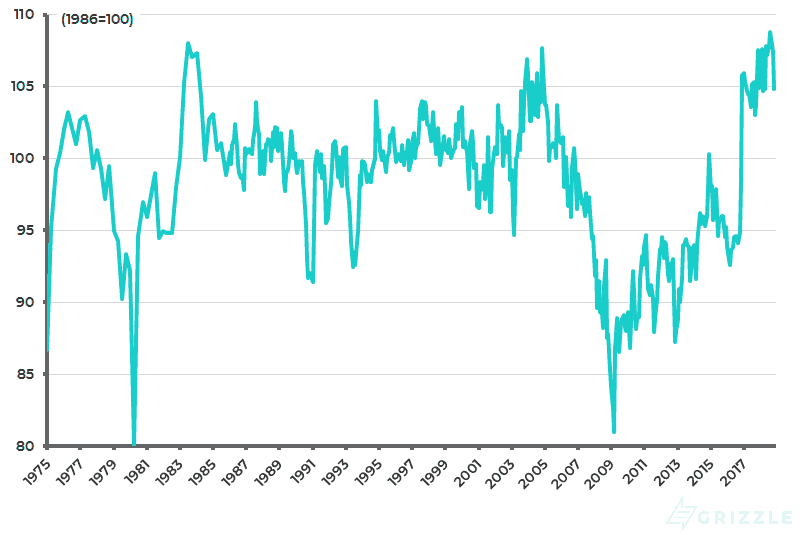
S&P500 sales rose by 10.7% YoY in 3Q18 following 11.2% YoY growth in 2Q18, the highest level since 2Q11. The macro data also shows that total business sales, including manufacturers, retailers, and merchant wholesalers, rose by 7.8% YoY in 2Q18 and 7.5% YoY in 3Q18, the highest level since 4Q11 (see following chart). It is also the case that the small business confidence index remains near historically high levels, suggesting the revival of such animal spirits though, interestingly, it declined significantly in November.
The NFIB Small Business Optimism Index rose to a record 108.8 in August and was 107.4 in October, though it fell by 2.6pts to 104.8 in November, the lowest level since April (see following chart).
US total business sales growth
Note: Including manufacturers, retailers and merchant wholesalers. Source: US Census Bureau, CLSA
NFIB Small Business Optimism Index
Source: National Federation of Independent Business (NFIB), CEIC Data
However, set against these positives is the growing evidence that higher interest rates have impacted households. In this respect, macro measures of the decline in household debt relative to GDP in this cycle (see following chart) do not incorporate the reality that the extremely unequal distribution of income means that most Americans still live month-to-month, which is why the stresses from monetary tightening are best shown by the rising interest payments made by American households.
Thus, personal interest payments, excluding mortgages, rose by 15.8% YoY to a record annualized US$349 billion in October and are up 55% since mid-2013 (see following chart).
In the short-term the American consumer will enjoy a windfall from the recent sharp fall in oil prices, courtesy of the Trump administration’s U-turn on Iran oil sanctions and the Donald’s successful bullying of Saudi Arabia to increase production to 11 million barrels a day following the recent unfortunate incident in Istanbul.
But the word is that such a level of production is not sustainable for Saudi’s aging oil fields, which is probably one reason among others why OPEC has agreed this month to a new production cut with Russia. Thus, OPEC and allied non-OPEC oil-producing countries, including Russia, agreed on Dec. 7 to cut oil production by 1.2mb/d from January for an initial period of six months (0.8mb/d from OPEC and 0.4mb/d from non-OPEC) with a review in April 2019.
US household debt as % of GDP
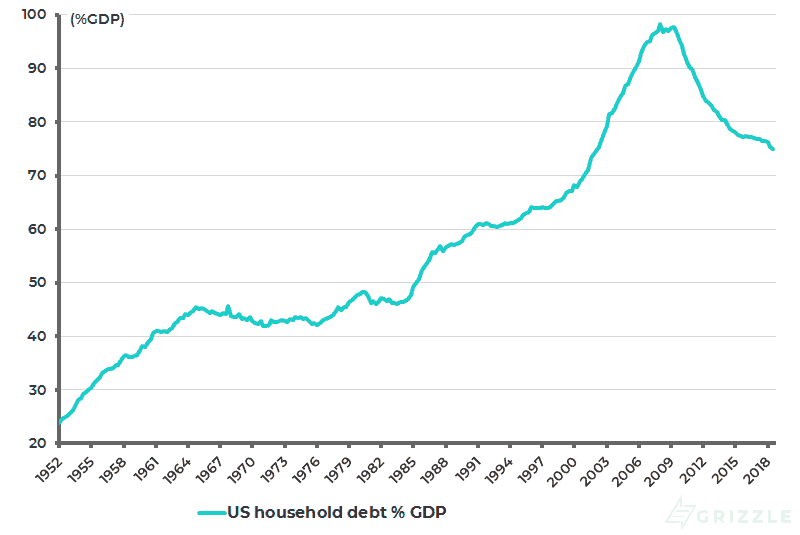
Source: Federal Reserve
US personal interest payments
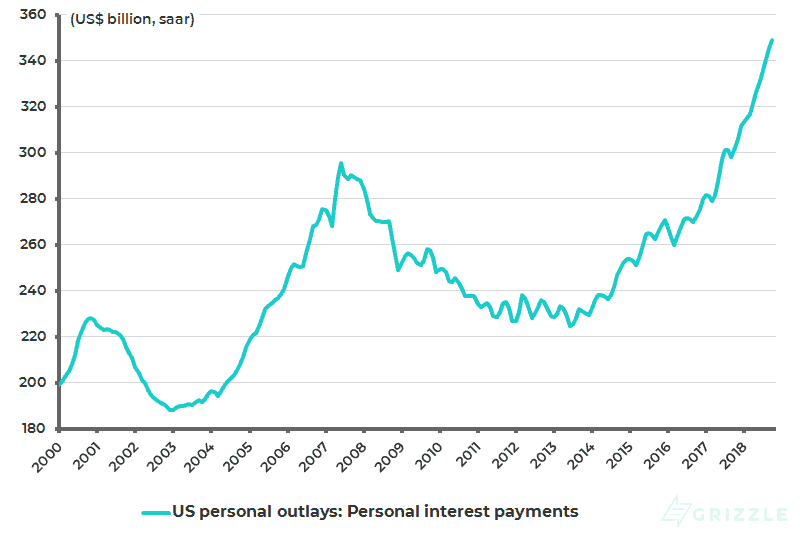
Note: Consists of non-mortgage interest paid by households. Source: US Bureau of Economic Analysis
About Author
The views expressed in Chris Wood’s column on Grizzle reflect Chris Wood’s personal opinion only, and they have not been reviewed or endorsed by Jefferies. The information in the column has not been reviewed or verified by Jefferies. None of Jefferies, its affiliates or employees, directors or officers shall have any liability whatsoever in connection with the content published on this website.
The opinions provided in this article are those of the author and do not constitute investment advice. Readers should assume that the author and/or employees of Grizzle hold positions in the company or companies mentioned in the article. For more information, please see our Content Disclaimer.
